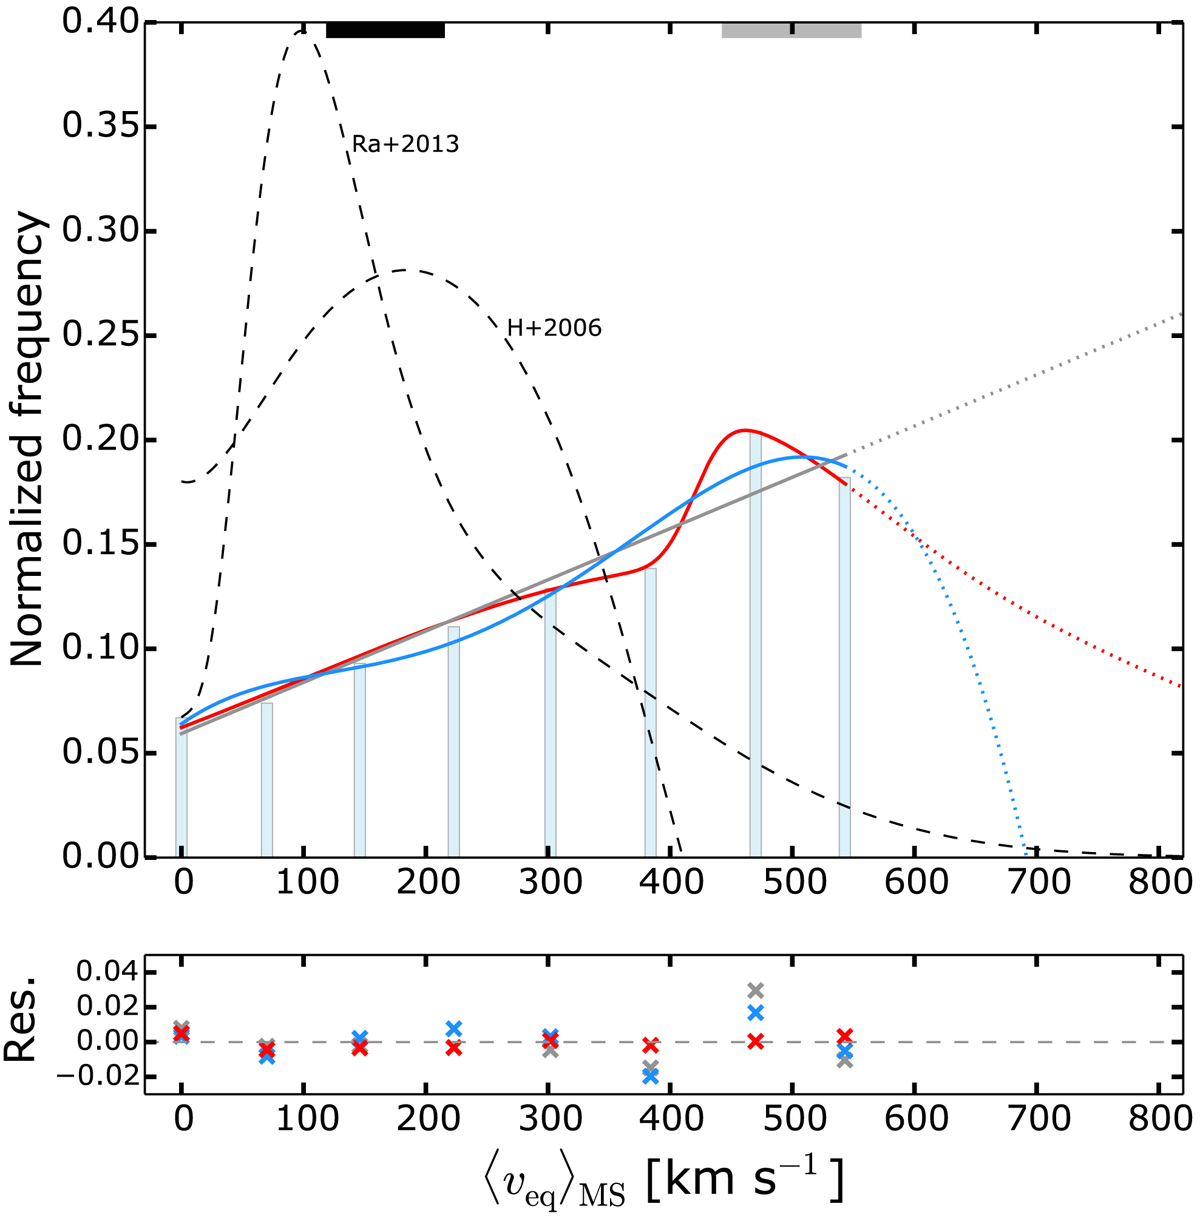
Fig. 12.
Distribution of the mean equatorial velocity during the MS for the EMP source star models. The three fits are the same as in Fig. 10, but adapted to the new x-axis (see text for details). The dashed black distributions show two equatorial velocity distributions reported in Huang & Gies (2006, H+2006) and Ramírez-Agudelo et al. (2013, Ra+2013), based on the observation of Galactic and LMC O-type and B-type stars (see text for details). The segments at the top show the υeq range during the MS for the vv6 model (grey) and for a 20 M⊙ model computed at solar metallicity with υini/υcrit = 0.3 (black).
Current usage metrics show cumulative count of Article Views (full-text article views including HTML views, PDF and ePub downloads, according to the available data) and Abstracts Views on Vision4Press platform.
Data correspond to usage on the plateform after 2015. The current usage metrics is available 48-96 hours after online publication and is updated daily on week days.
Initial download of the metrics may take a while.