Free Access
Fig. 10.
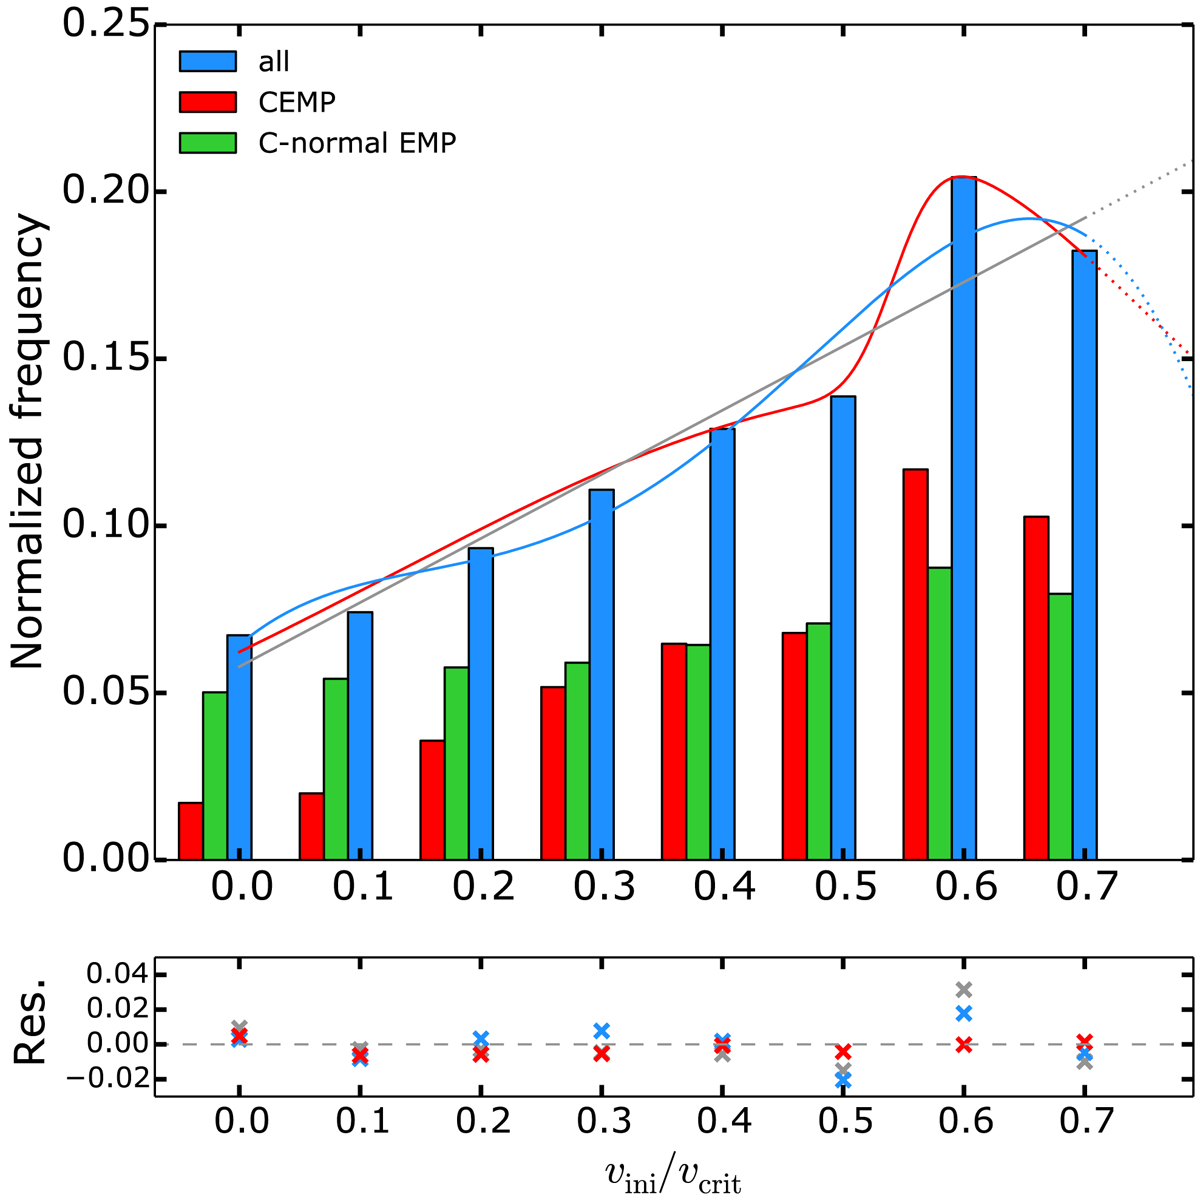
Distribution of the source stars υini/υcrit values derived from the CEMP sample (red), the C-normal EMP sample (green), and the entire sample (blue). Three fits of the distribution are shown (red, blue, and grey curves; see text for details) together with their associated residuals (bottom panel).
Current usage metrics show cumulative count of Article Views (full-text article views including HTML views, PDF and ePub downloads, according to the available data) and Abstracts Views on Vision4Press platform.
Data correspond to usage on the plateform after 2015. The current usage metrics is available 48-96 hours after online publication and is updated daily on week days.
Initial download of the metrics may take a while.