Fig. 5.
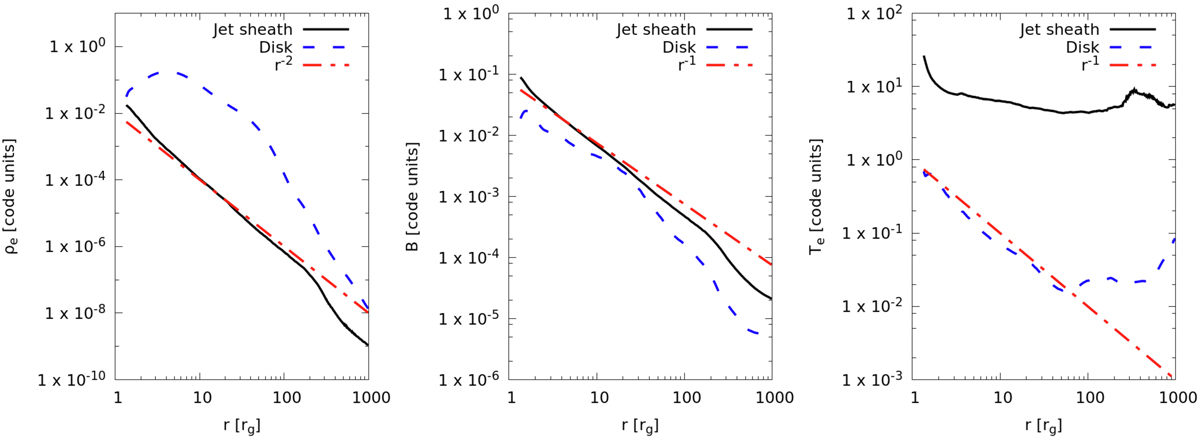
Lineprofiles. To compare our simulation with analytical prediction for plasma quantities by Blandford & Königl (1979) and Falcke & Biermann (1995) in the jet we computed radial profiles. We show radial profiles of the dimensionless electron density (left), magnetic-field strength (middle) and electron temperature (right). Black lines correspond to jet averaged quantities, dashed yellow lines to disk-averaged quantities and the red dashed lines correspond to power-law profiles predicted in analytical works. Also, the jet sheath is close to isothermality.
Current usage metrics show cumulative count of Article Views (full-text article views including HTML views, PDF and ePub downloads, according to the available data) and Abstracts Views on Vision4Press platform.
Data correspond to usage on the plateform after 2015. The current usage metrics is available 48-96 hours after online publication and is updated daily on week days.
Initial download of the metrics may take a while.