Free Access
Fig. 9.
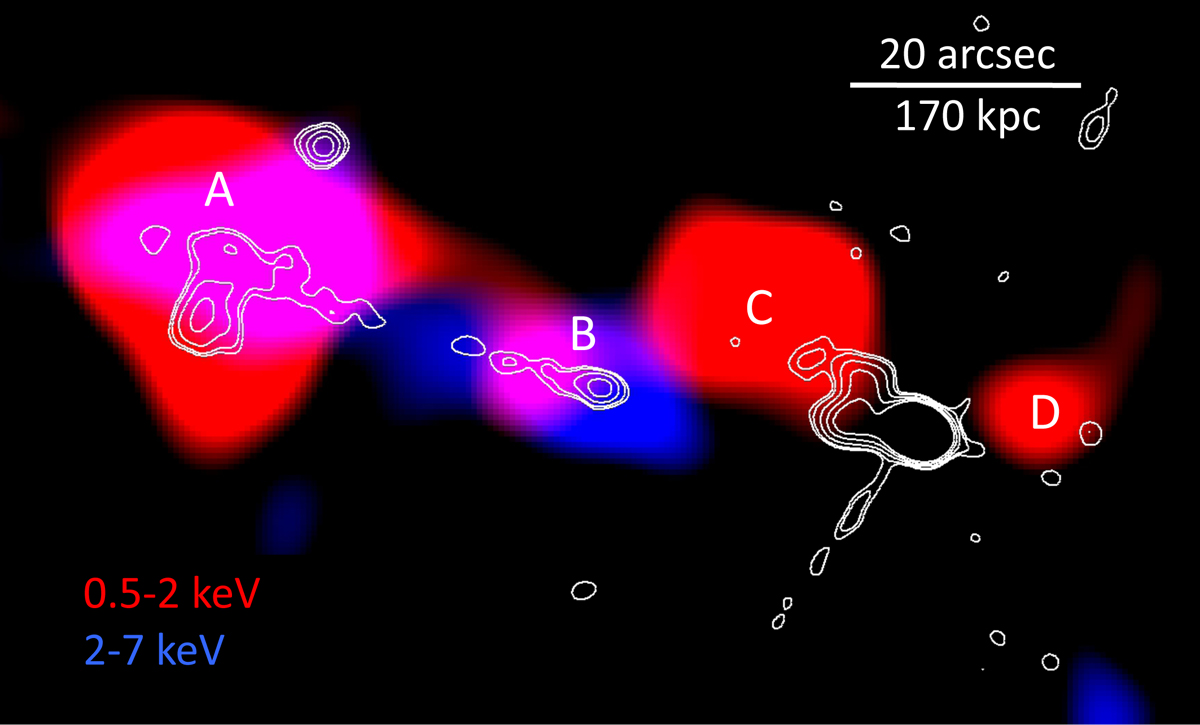
Point-source subtracted and smoothed Chandra/ACIS-I X-ray color image of the diffuse emission (see text for details). Soft (0.5–2 keV) and hard (2–7 keV) X-rays are shown in red and blue, respectively. The X-ray emission is shown down to a ∼2.5σ significance level. Radio contours are shown in white.
Current usage metrics show cumulative count of Article Views (full-text article views including HTML views, PDF and ePub downloads, according to the available data) and Abstracts Views on Vision4Press platform.
Data correspond to usage on the plateform after 2015. The current usage metrics is available 48-96 hours after online publication and is updated daily on week days.
Initial download of the metrics may take a while.