Fig. 8.
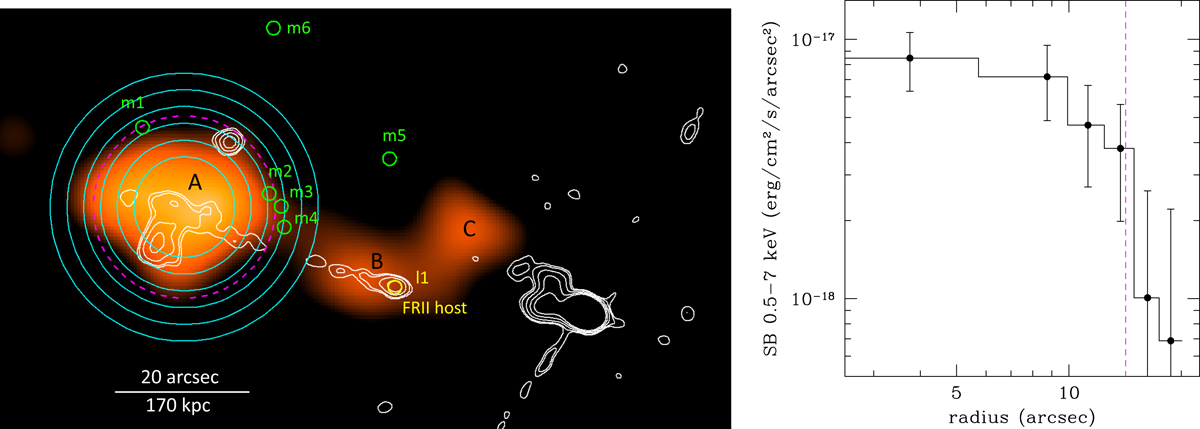
Left: point-source subtracted and smoothed Chandra/ACIS-I image in the 0.5–7 keV band. The main components A, B, and C of the diffuse X-ray emission are marked. Galaxies at z = 1.69 are labeled as in Fig. 1 and Table 1 (l2 falls outside this image). VLA radio contours at 1.4 GHz are overplotted in white (same levels as in Fig. 7): they show the full morphology (with jet and lobes) of the FRII radio galaxy and an additional radio source that is also possibly part of the overdensity (see text). The annuli used to compute the surface brightness profile of component A (see right panel) are shown in cyan. The dashed magenta circle (14″ radius around the X-ray centroid) shows the location of the overdensity galaxies m1 − m4. Right: surface brightness profile of the diffuse component A as measured on the (point-source subtracted) Chandra 0.5–7 keV image before smoothing, and using the extraction annuli shown in the left panel. The radial profile is background subtracted and a power-law spectrum with Γ = 1.6 is assumed to convert count rates into fluxes. The radius at which the m1 − m4 galaxies are found is shown by the magenta vertical line. The X-ray surface brightness sharply decreases at this radius, and is consistent with zero beyond it.
Current usage metrics show cumulative count of Article Views (full-text article views including HTML views, PDF and ePub downloads, according to the available data) and Abstracts Views on Vision4Press platform.
Data correspond to usage on the plateform after 2015. The current usage metrics is available 48-96 hours after online publication and is updated daily on week days.
Initial download of the metrics may take a while.