Fig. 3.
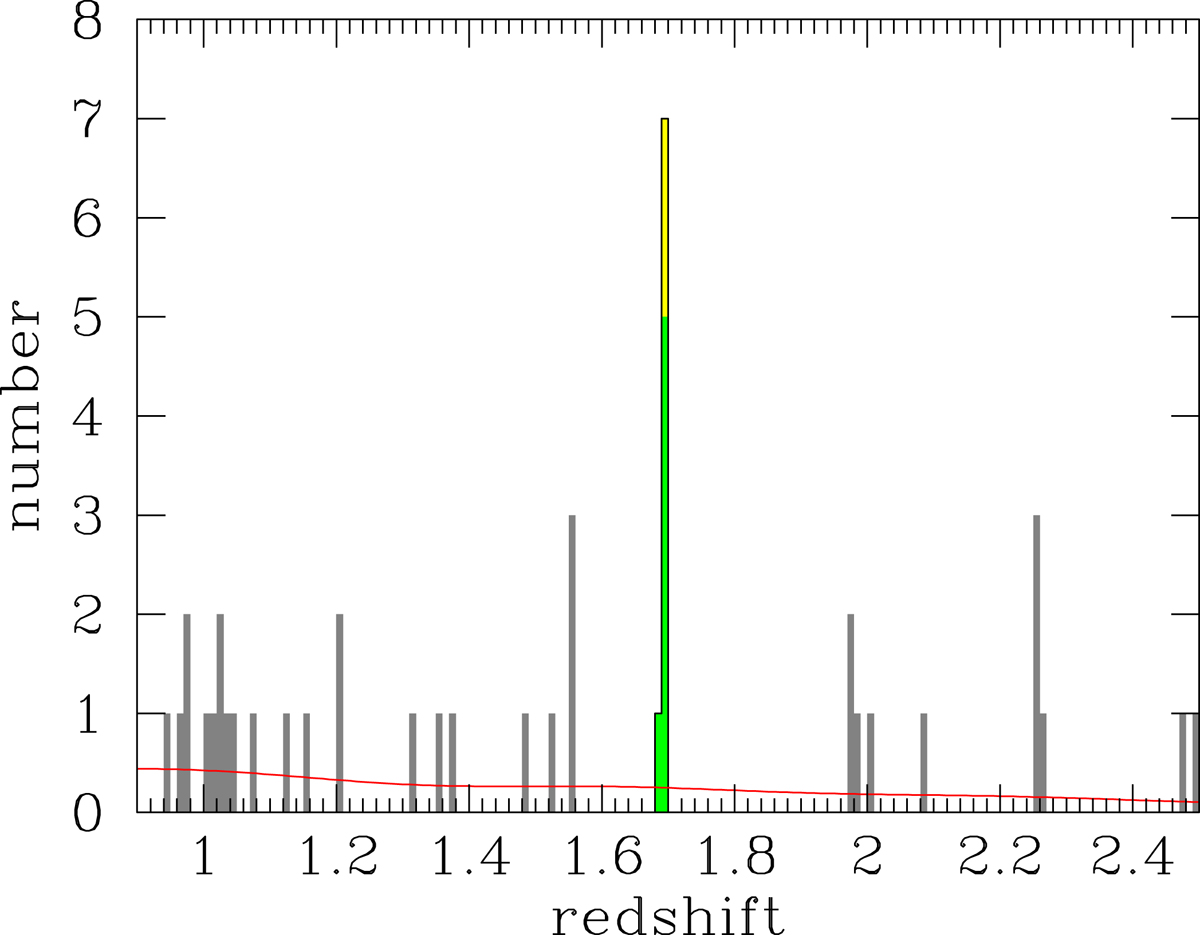
Redshift distribution of MUSE sources at z = 0.9 − 2.5 in bins of Δz = 0.01 (gray histogram). The six MUSE sources (m1 − m6) in the z = 1.69 overdensity are shown in light green. The red curve shows the expected background curve, obtained by smoothing the MUSE redshift distribution, used to quantify the significance of the redshift structure. The two additional sources at z = 1.69 found by LUCI (including the FRII host) are shown in yellow.
Current usage metrics show cumulative count of Article Views (full-text article views including HTML views, PDF and ePub downloads, according to the available data) and Abstracts Views on Vision4Press platform.
Data correspond to usage on the plateform after 2015. The current usage metrics is available 48-96 hours after online publication and is updated daily on week days.
Initial download of the metrics may take a while.