Fig. 12.
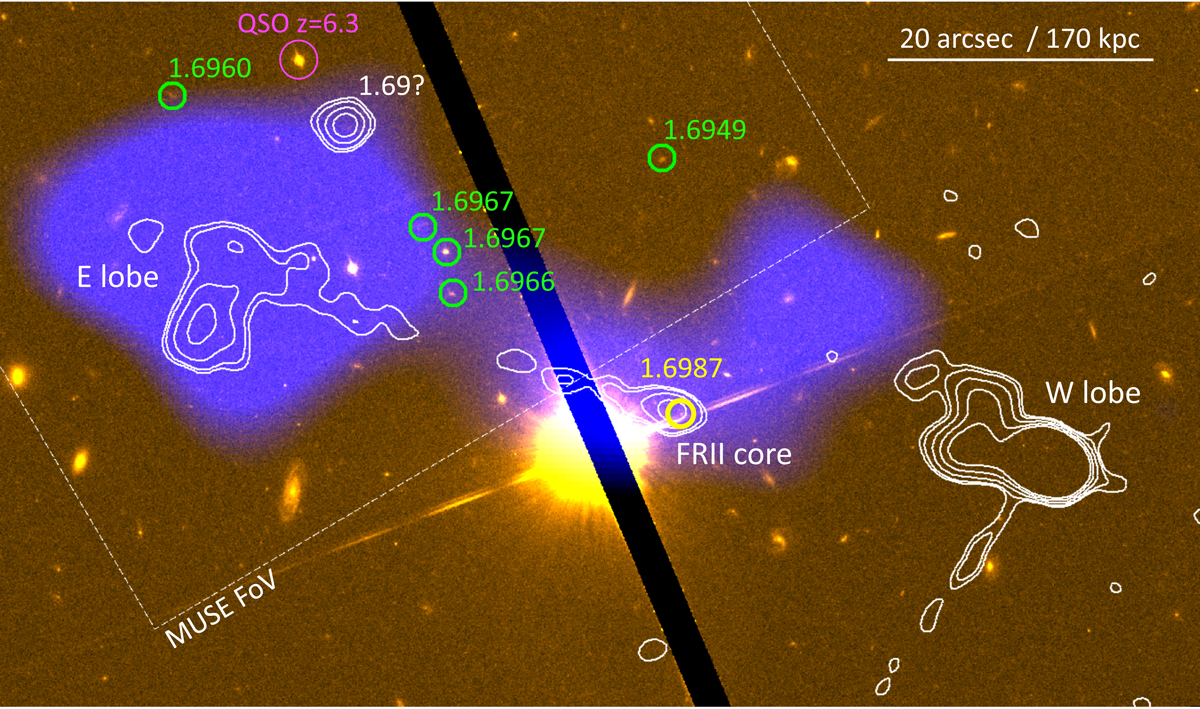
HST/ACS F850LP image of the overdensity overlaid with radio contours from the VLA (in white, same levels as in Fig. 7) and the Chandra/ACIS-I smoothed image of diffuse X-ray emission (blue-violet; 0.5–7 keV band, point sources removed). North is up and east is to the left. The dark strip running across the bright star is the gap between the two ACS CCDs. The main radio morphological features of the FRII galaxy are labeled in white. The position of the MUSE pointing is shown. The position of the FRII host and its redshift are shown in yellow. Green circles mark MUSE galaxies in the overdensity; their redshifts are as labeled. The additional radio source that may be part of the overdensity (1.4 < zphot < 1.9 at 68% confidence level) is labeled in white. The position of the z = 6.3 QSO SDSS J1030+0524 is also marked in magenta.
Current usage metrics show cumulative count of Article Views (full-text article views including HTML views, PDF and ePub downloads, according to the available data) and Abstracts Views on Vision4Press platform.
Data correspond to usage on the plateform after 2015. The current usage metrics is available 48-96 hours after online publication and is updated daily on week days.
Initial download of the metrics may take a while.