Fig. 2
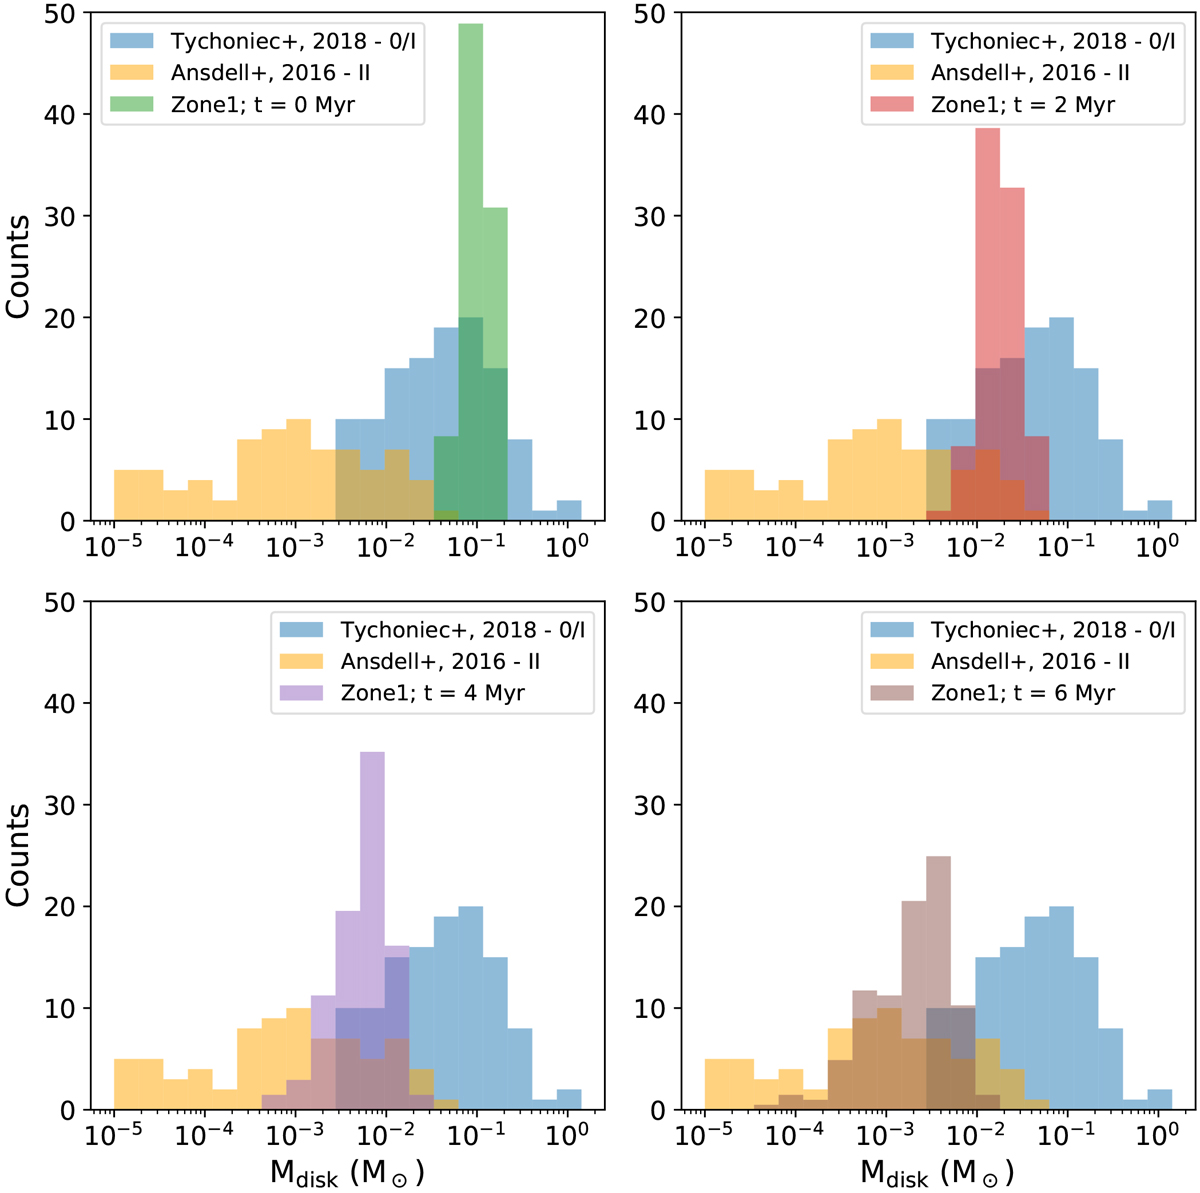
Comparison of distribution of disk masses in our population of Zone 1 planets, evolved using the model presented in Sect. A.1. We show the mass of each of the disk models at its initial time, 2, 4, and 6 Myr into their evolution, even if the disk lifetime for any particular disk model is shorter than those times. We compare to the disk masses measured in a population of class 0/I from Tychoniec et al. (2018) and to a population of class II objects from Ansdell et al. (2016).
Current usage metrics show cumulative count of Article Views (full-text article views including HTML views, PDF and ePub downloads, according to the available data) and Abstracts Views on Vision4Press platform.
Data correspond to usage on the plateform after 2015. The current usage metrics is available 48-96 hours after online publication and is updated daily on week days.
Initial download of the metrics may take a while.