Fig. 9.
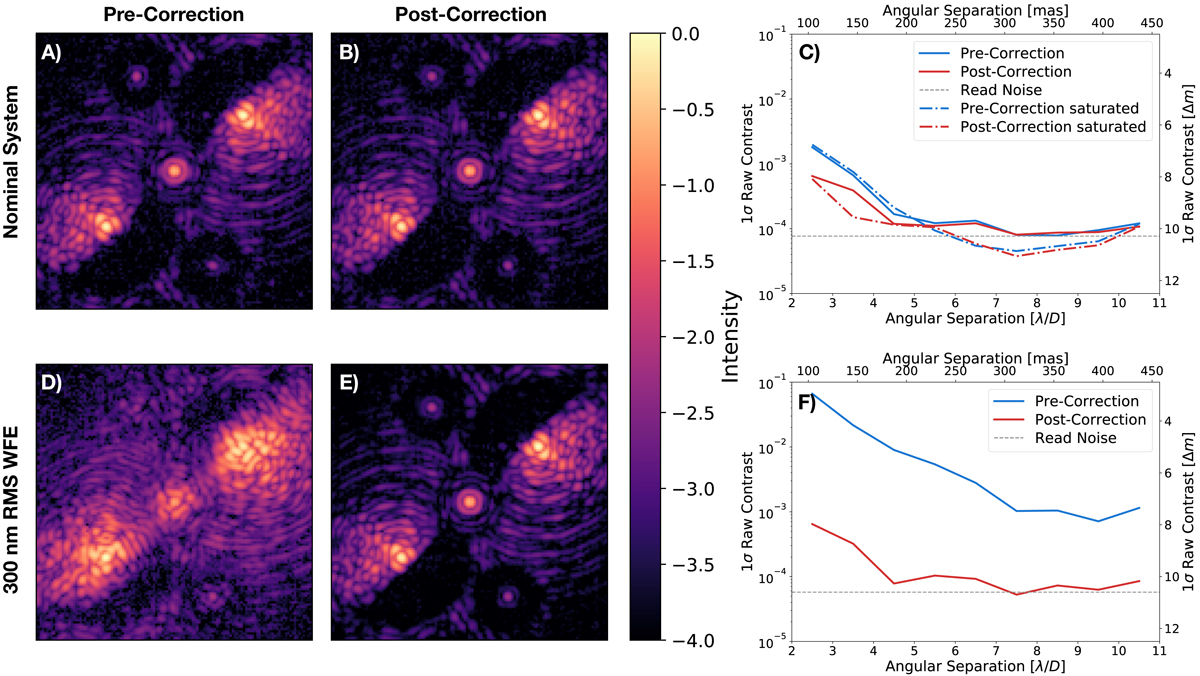
Focal-plane images and 1σ raw contrast curves pre- and post-correction with the internal source within SCExAO. (a) pre- and (b) post-correction images for the nominal SCExAO system. (c) 1σ raw contrast curves for the correction of the nominal system. The solid lines relate to (panels a and b) and are read noise limited beyond 7.5 λ/D, which is shown by the horizontal dashed line. The dot-dashed lines show a similar correction performed at a different time. For these lines the images for raw contrast determination were saturated such that they were speckle noise limited (instead of read noise limited), reaching deeper contrasts in the dark holes. (d) pre- and (e) post-correction images for an introduced wavefront of 300 nm rms. (f) 1σ raw contrast curves for the correction of the system with the introduced 300 nm rms wavefront, with again the horizontal dashed line denoting the read noise.
Current usage metrics show cumulative count of Article Views (full-text article views including HTML views, PDF and ePub downloads, according to the available data) and Abstracts Views on Vision4Press platform.
Data correspond to usage on the plateform after 2015. The current usage metrics is available 48-96 hours after online publication and is updated daily on week days.
Initial download of the metrics may take a while.