Fig. 11.
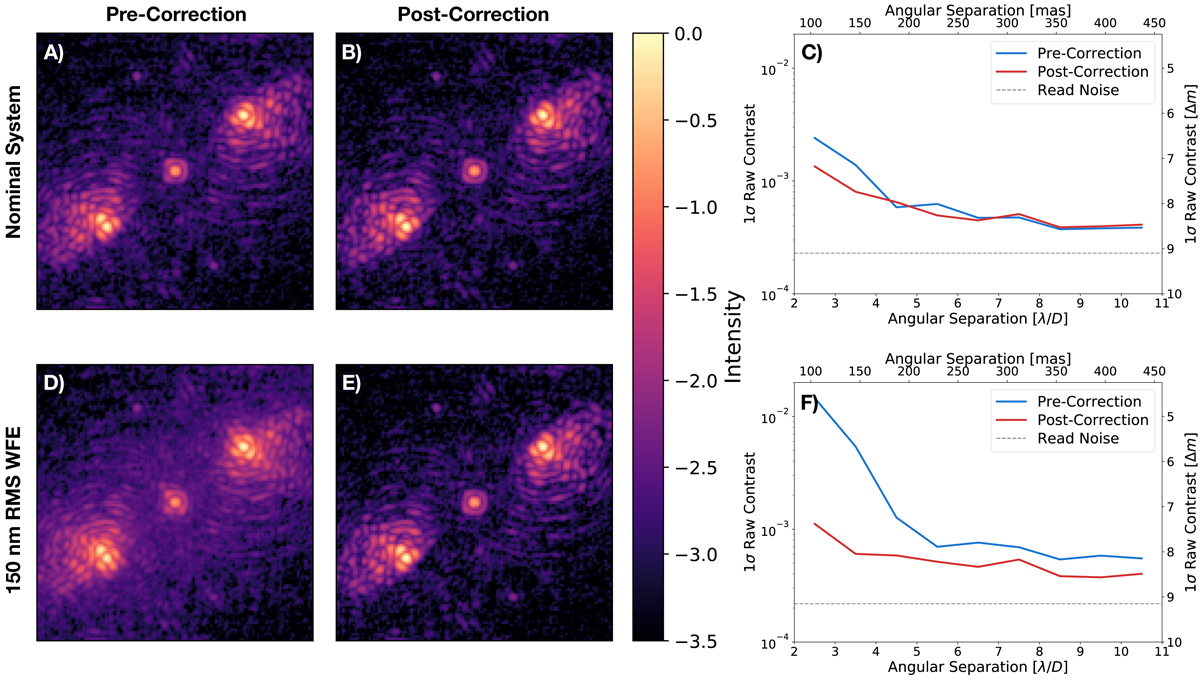
Focal-plane images and 1σ raw contrast curves pre- and post-correction during on-sky observations. (a) pre- and (b) post-correction images for the nominal SCExAO system. (c) 1σ raw contrast curves for the correction of the nominal system. The horizontal dashed line denotes the read noise level. (d) pre- and (e) post-correction images for an additional wavefront error of 150 nm rms. (f) 1σ raw contrast curves for the correction of the system with the additional 150 nm rms wavefront error, with again the horizontal dashed line denoting the read noise.
Current usage metrics show cumulative count of Article Views (full-text article views including HTML views, PDF and ePub downloads, according to the available data) and Abstracts Views on Vision4Press platform.
Data correspond to usage on the plateform after 2015. The current usage metrics is available 48-96 hours after online publication and is updated daily on week days.
Initial download of the metrics may take a while.