Fig. 7.
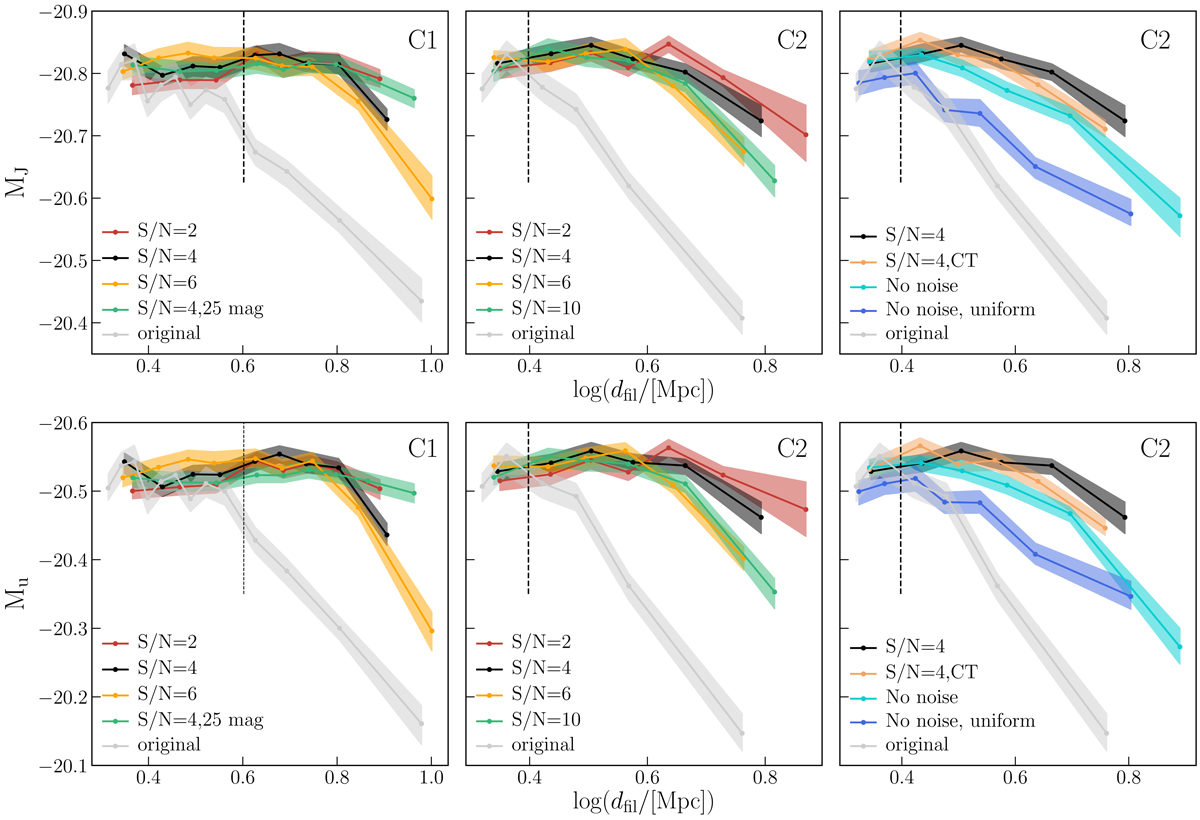
Distributions of the mean MJ (top) and Mu (bottom) galaxy rest-frame magnitudes as a function of the distance to the filaments (dfil) for galaxies with logM⋆/M⊙ > 9.0. Results are shown for the C1 (left column) and the C2 (middle column) configurations. Right column: additional flavours of the C2 configuration (see Sect. 2.1.4 and the caption of Fig. 4 for details). The vertical dashed line indicates the reconstruction scales LT of 4 and 2.5 Mpc for the C1 and C2 configurations, respectively. Below this scale, no trend is expected towards the reconstructed filaments.
Current usage metrics show cumulative count of Article Views (full-text article views including HTML views, PDF and ePub downloads, according to the available data) and Abstracts Views on Vision4Press platform.
Data correspond to usage on the plateform after 2015. The current usage metrics is available 48-96 hours after online publication and is updated daily on week days.
Initial download of the metrics may take a while.