Free Access
Fig. 5.
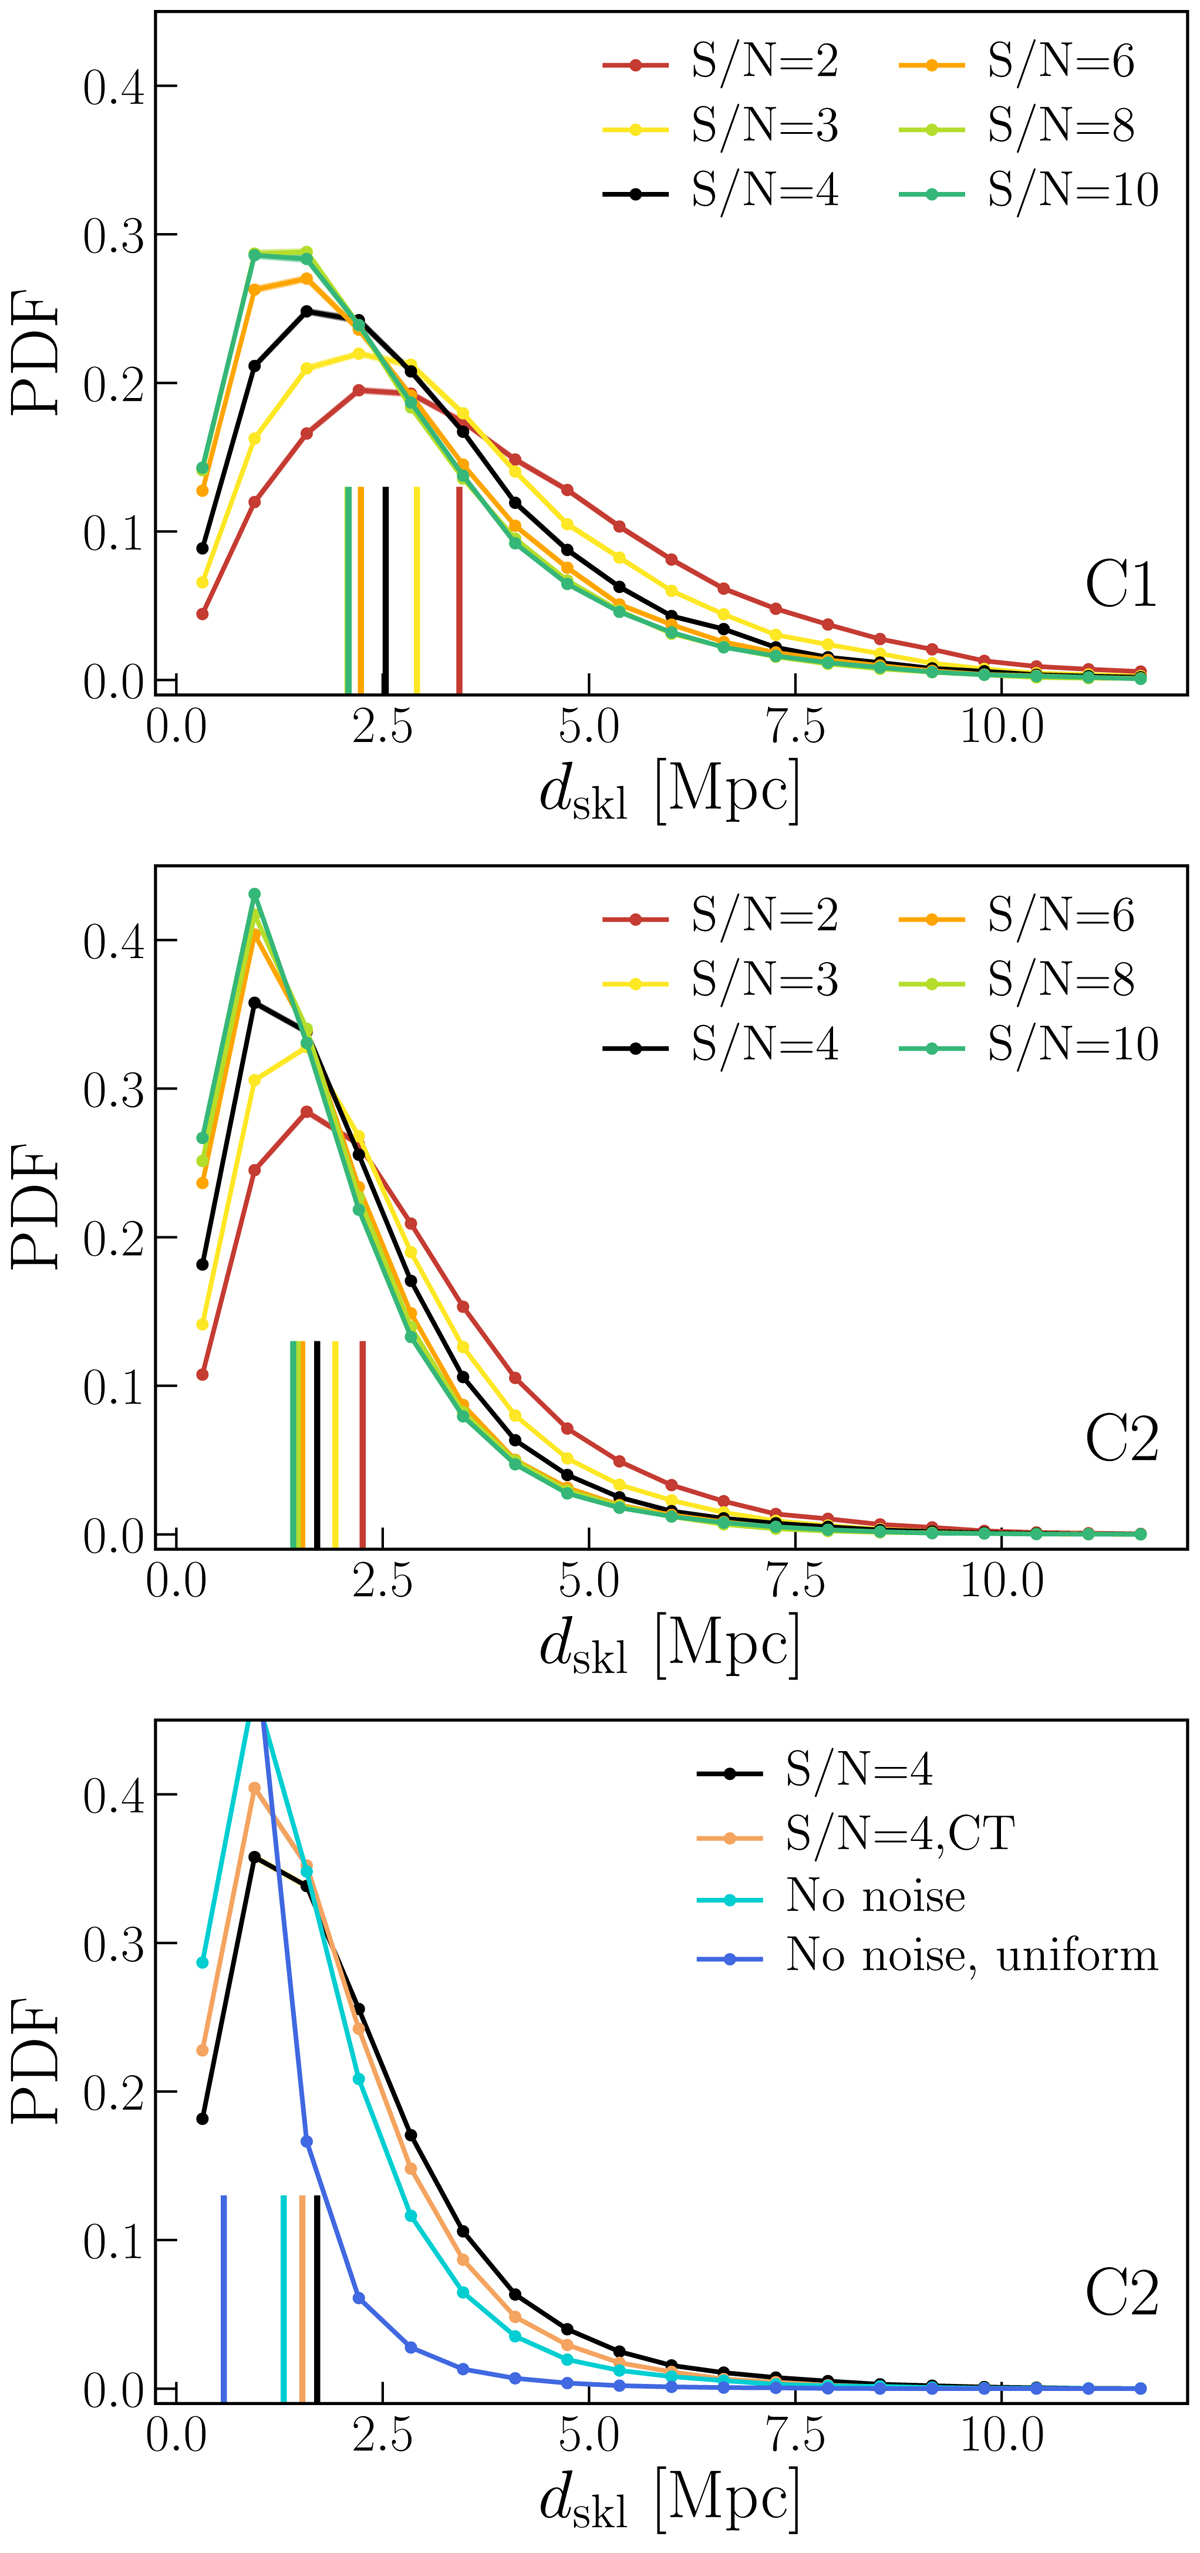
Probability density function of the pseudo-distance between the skeletons computed on the original and reconstructed fields in the C1 (top) and C2 (middle and bottom) configurations for various S/N (see the caption of Fig. 4 and Sect. 2.1.4 for details). Vertical lines indicate the median values of the distributions.
Current usage metrics show cumulative count of Article Views (full-text article views including HTML views, PDF and ePub downloads, according to the available data) and Abstracts Views on Vision4Press platform.
Data correspond to usage on the plateform after 2015. The current usage metrics is available 48-96 hours after online publication and is updated daily on week days.
Initial download of the metrics may take a while.