Fig. 4.
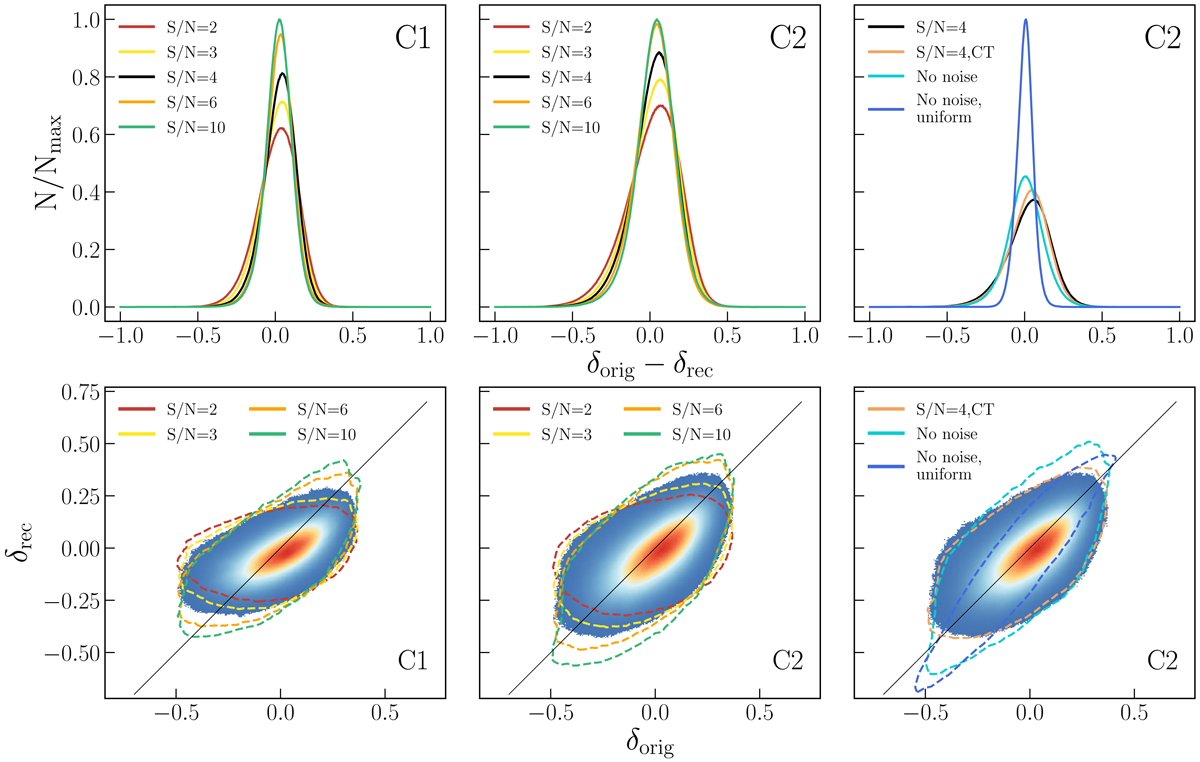
Assessing the quality of the reconstructed flux contrast field. The quality is checked for the different values of S/N and two different configurations, corresponding to the resolution of R = 1000 and the reconstruction scale of LT = 4 Mpc (configuration C1, left column) and the resolution of R = 2000 and the reconstruction scale of LT = 2.5 Mpc (configuration C2, middle column). Right column: 3 additional flavors of the C2 configuration (see Sect. 2.1.4 for details), with a constant exposure time and at least S/N = 4 on all spectra (S/N = 4,CT), with no noise on spectra (No noise) and with a spatially uniform background sources distribution (No noise, uniform). Upper row: distributions of the pixel-by-pixel differences between the smoothed original and reconstructed flux contrast fields. Note that the distributions are normalized in a way that the peak of the narrowest distribution equals 1. Bottom row: scatter plots of the original flux contrast field (for S/N = 4) against the reconstructed one. The original field has been smoothed with the same LT scale as the corresponding reconstructed one. Black line shows δrec = δorig relation. Overplotted contours of number counts (computed at a level of 10 counts and smoothed afterwards) show the change of the 2D distribution for reconstruction for different S/N values of the spectra.
Current usage metrics show cumulative count of Article Views (full-text article views including HTML views, PDF and ePub downloads, according to the available data) and Abstracts Views on Vision4Press platform.
Data correspond to usage on the plateform after 2015. The current usage metrics is available 48-96 hours after online publication and is updated daily on week days.
Initial download of the metrics may take a while.