Fig. 3.
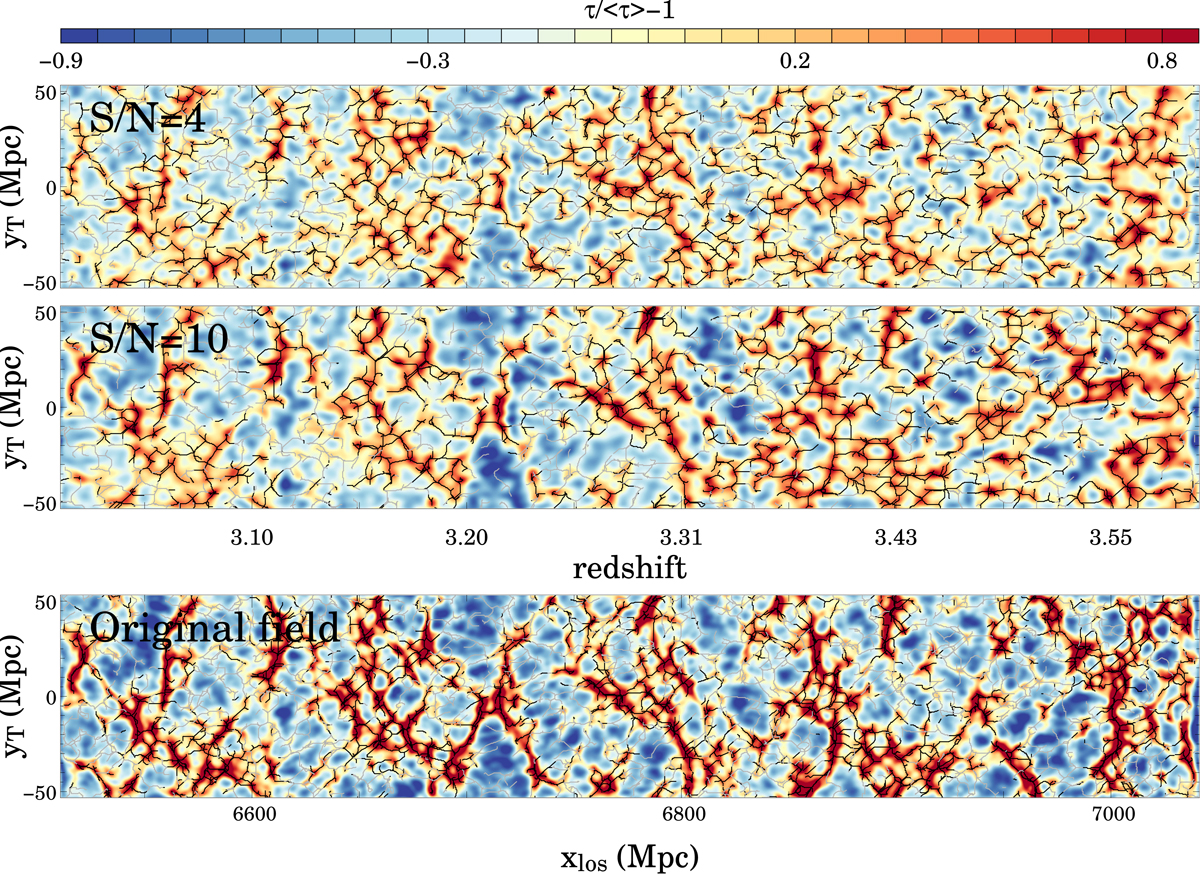
Longitudinal slices of thickness ∼10 Mpc (i.e. four times the smoothing length) of the reconstructed (top for S/N = 4 and middle for S/N = 10) and original (bottom) optical depth contrast field τ/⟨τ⟩−1, where τ = −logF and F is transmitted flux. τ is taken as a proxy for the HI density. The original field is smoothed with a Gaussian kernel over 2.5 Mpc. Filaments extracted with DISPERSE are overplotted in grey and black. The black lines correspond to the 50% densest filaments. As noise in the spectra increases, the reconstruction shows lower contrast, and filaments are more randomly located.
Current usage metrics show cumulative count of Article Views (full-text article views including HTML views, PDF and ePub downloads, according to the available data) and Abstracts Views on Vision4Press platform.
Data correspond to usage on the plateform after 2015. The current usage metrics is available 48-96 hours after online publication and is updated daily on week days.
Initial download of the metrics may take a while.