Fig. C.4.
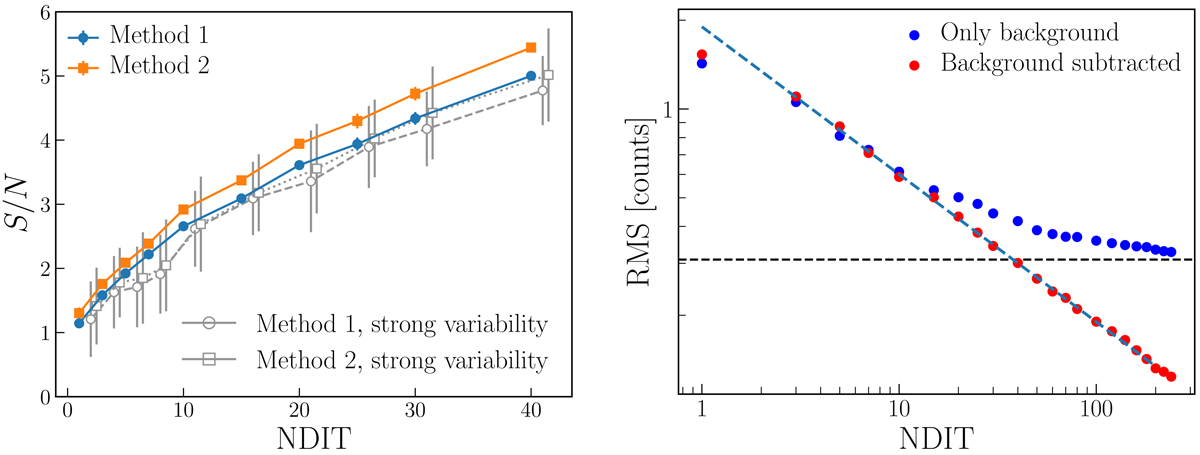
Towards understanding the effect of sky variability on the S/N in the case of HMM observations. Left: signal-to-noise ratio as a function of NDIT for two different methods of background subtraction (see text). The coloured points correspond to the simulation with an average sky variability (Puech et al. 2012), and the grey points correspond to the simulation with enhanced amplitudes of sky variability. The latter points are shifted in the x-axis direction for the purpose of visualization. Right: RMS as a function of NDIT for one simulation in the case of very bad sky conditions, i.e. when the amplitude of sky variations is ten times stronger than the typical variations. The blue curve corresponds to the RMS of the sky alone (i.e. equivalent to the observation of the sky), while the red curve corresponds to the RMS of the source spectrum after the background is subtracted. The values are given with respect to the normalized (=1) continuum. The red curve has been scaled in the y-axis in order to match the blue curve for small NDIT. The dashed black line shows the amplitude of the sky variations. The dashed blue line indicates the decline expected in the case of Poissonian noise (NDIT−0.5).
Current usage metrics show cumulative count of Article Views (full-text article views including HTML views, PDF and ePub downloads, according to the available data) and Abstracts Views on Vision4Press platform.
Data correspond to usage on the plateform after 2015. The current usage metrics is available 48-96 hours after online publication and is updated daily on week days.
Initial download of the metrics may take a while.