Fig. C.3.
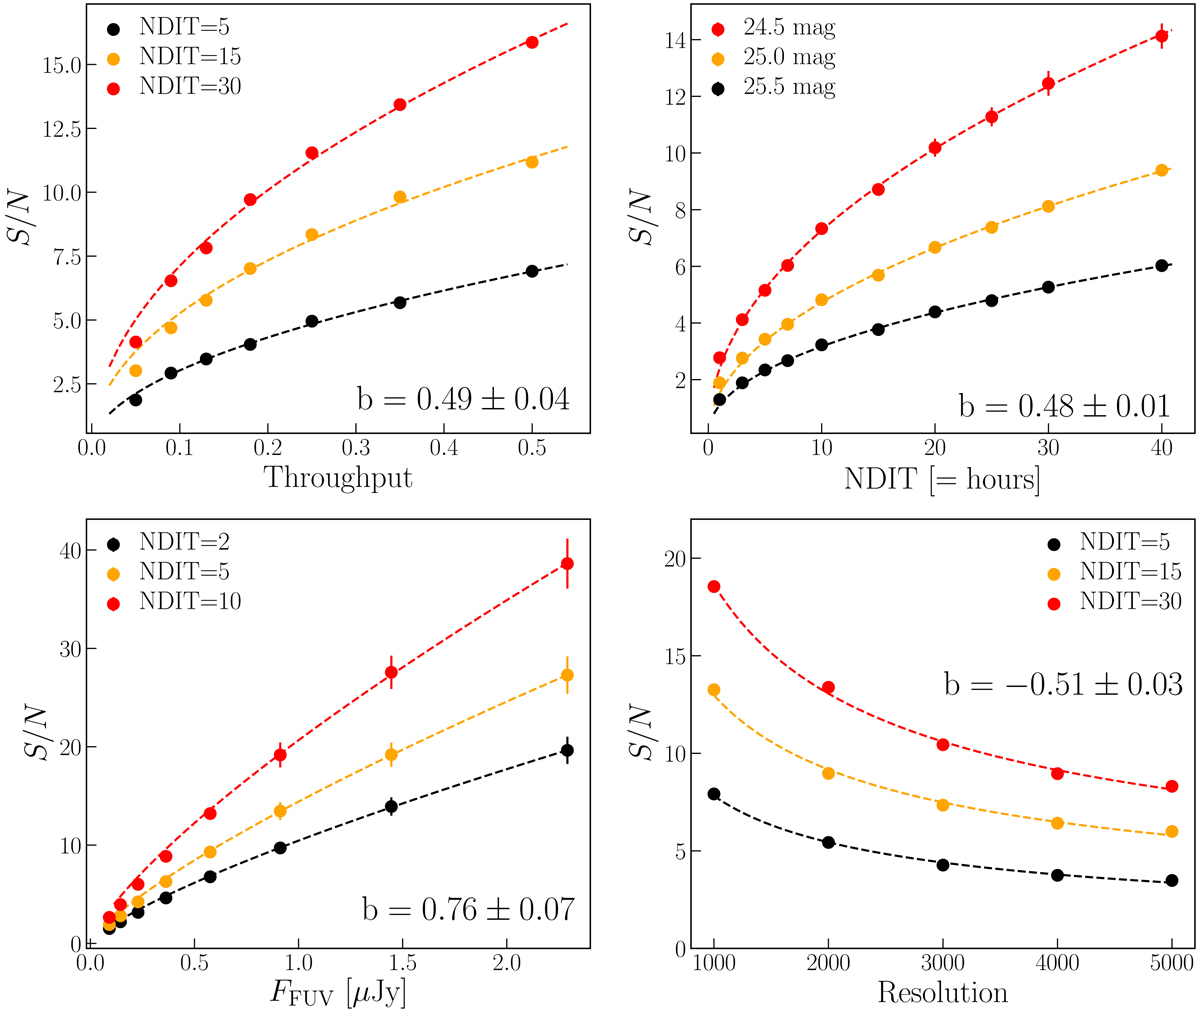
Representative plots to show how S/N scales (for the HMM-VIS mode) with the number of exposures (exposure time), resolution, total throughput, and brightness of the source. Scalings were obtained by fitting a power-law function (x/x0)b to each S/N curve, where x represents one of the four quantities, x0 is the normalization (see text and Eq. (5)), and b is a power-law index.
Current usage metrics show cumulative count of Article Views (full-text article views including HTML views, PDF and ePub downloads, according to the available data) and Abstracts Views on Vision4Press platform.
Data correspond to usage on the plateform after 2015. The current usage metrics is available 48-96 hours after online publication and is updated daily on week days.
Initial download of the metrics may take a while.