Fig. B.5.
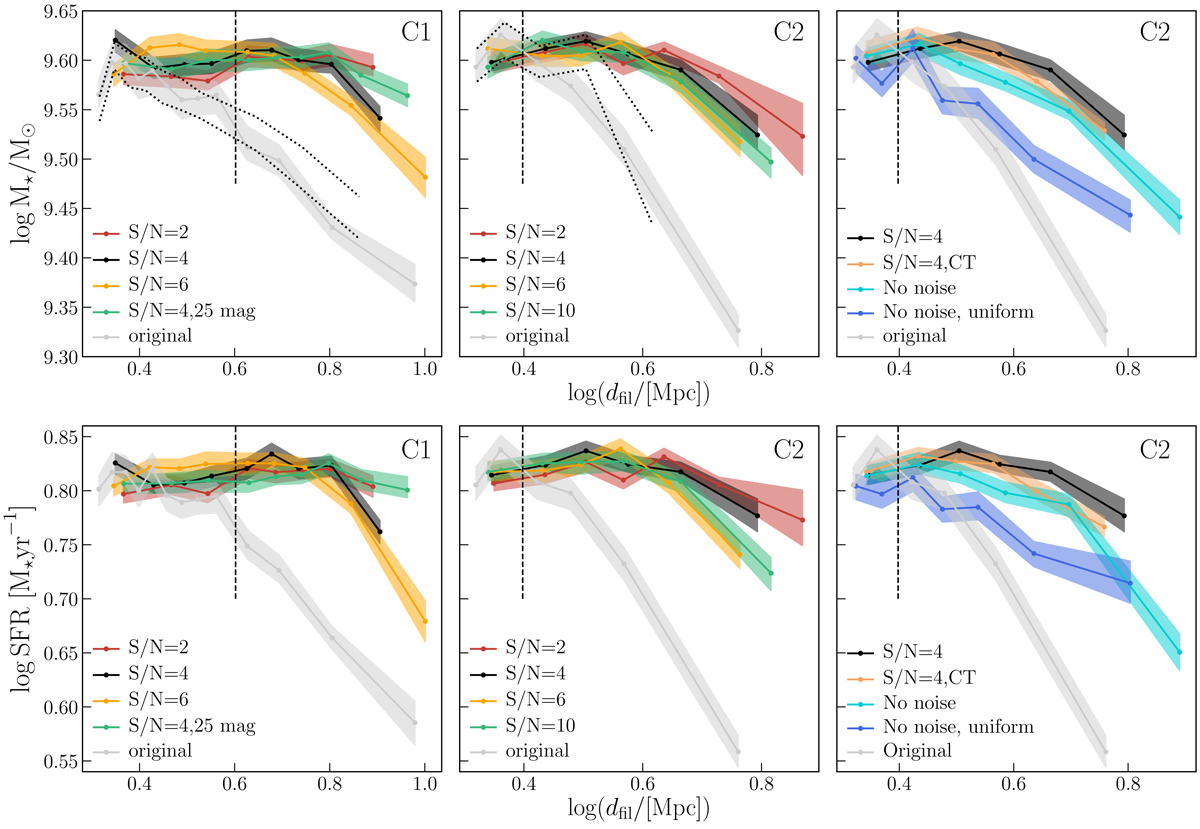
Distributions of the mean galaxy stellar mass (top) and SFR (bottom) as a function of the distance to the filaments (dfil) for galaxies with logM⋆/M⊙ > 9.0. Results are shown for the C1 (R = 1000) and the C2 (R = 2000) configurations. The vertical dashed line indicates the reconstruction scales of 4 and 2.5 Mpc for the C1 and C2 configuration, respectively. The dotted black lines show the mass gradient in the original field when all the filaments (not only the densest 50%) are kept in the analysis.
Current usage metrics show cumulative count of Article Views (full-text article views including HTML views, PDF and ePub downloads, according to the available data) and Abstracts Views on Vision4Press platform.
Data correspond to usage on the plateform after 2015. The current usage metrics is available 48-96 hours after online publication and is updated daily on week days.
Initial download of the metrics may take a while.