Fig. 2.
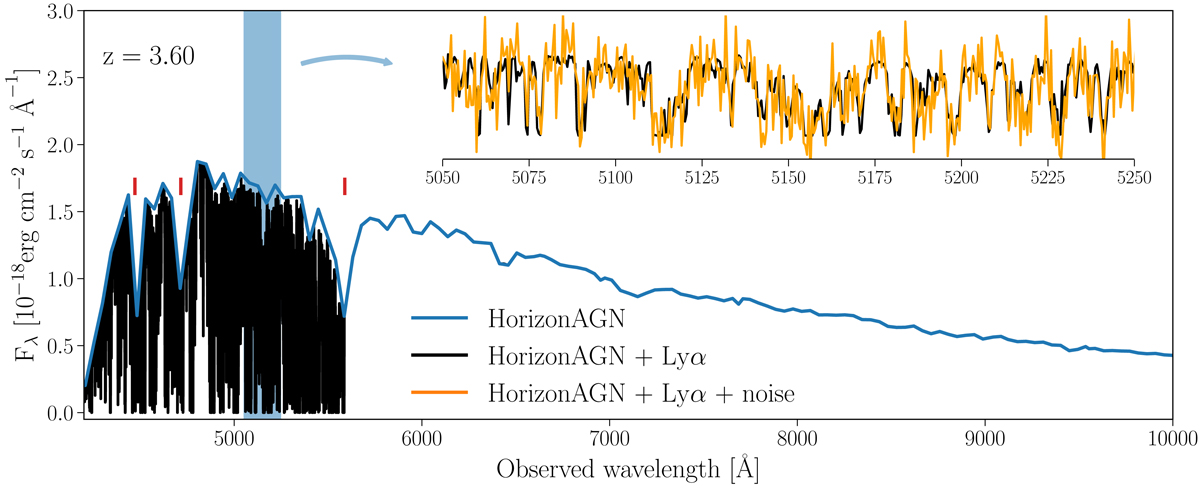
Example of a galaxy spectrum simulated in the Horizon-AGN simulation. The galaxy lies at z = 3.60 and has a magnitude of mrest, UV = 25.05 mag. Its synthetic spectrum is shown in blue. Red dashes indicate the positions of the Lyα, Lyβ, and Lyγ lines that originate in the galaxy. A spectrum with the added Lyα forest (even though we do not use it in the further analysis, we also plot the Lyβ forest etc.) is shown in black. Gaussian noise is added to this spectrum (see text for details), and the resulting spectrum is shown in orange in the zoomed plot. The noise corresponds to S/N = 5 and a resolution of R = 5000 (an exposure of ∼1.5 h at a fiducial resolution of MOSAIC, see Sect. 3).
Current usage metrics show cumulative count of Article Views (full-text article views including HTML views, PDF and ePub downloads, according to the available data) and Abstracts Views on Vision4Press platform.
Data correspond to usage on the plateform after 2015. The current usage metrics is available 48-96 hours after online publication and is updated daily on week days.
Initial download of the metrics may take a while.