Free Access
Fig. B.1.
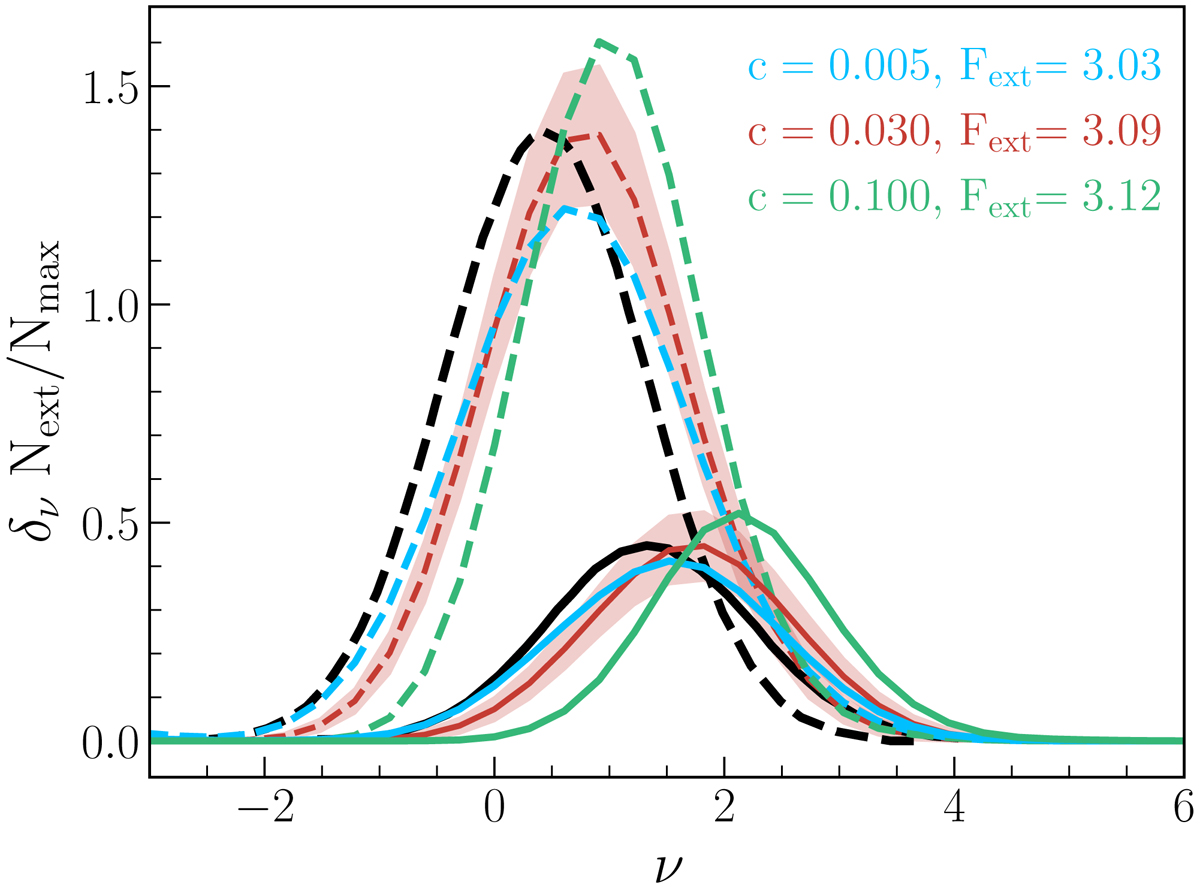
Counts of saddle points (dashed line) and maxima (solid line) in the original field for different persistence cuts of the skeleton. The black lines correspond to the theoretical prediction for a Gaussian field with spectral index ns = −2.
Current usage metrics show cumulative count of Article Views (full-text article views including HTML views, PDF and ePub downloads, according to the available data) and Abstracts Views on Vision4Press platform.
Data correspond to usage on the plateform after 2015. The current usage metrics is available 48-96 hours after online publication and is updated daily on week days.
Initial download of the metrics may take a while.