Fig. 13.
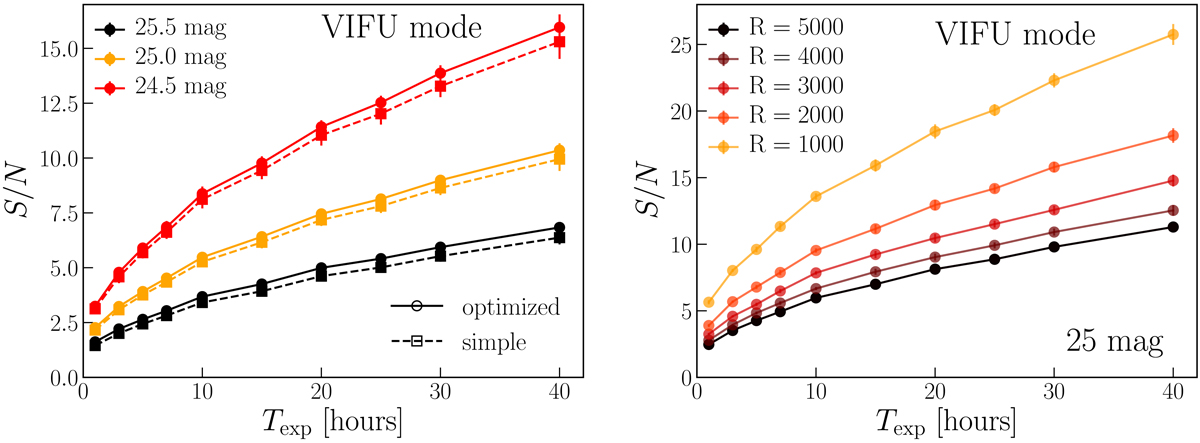
Left: signal-to-noise ratio per resolution element as a function of exposure time for galaxies of three different brightnesses at z = 3.3. S/N is estimated from integrated spectra obtained with two different methods; see the text for details. Right: illustration of the change in S/N if the original R = 5000 spectrum (for a mUV, rest = 25 mag) is smoothed down to a lower resolution.
Current usage metrics show cumulative count of Article Views (full-text article views including HTML views, PDF and ePub downloads, according to the available data) and Abstracts Views on Vision4Press platform.
Data correspond to usage on the plateform after 2015. The current usage metrics is available 48-96 hours after online publication and is updated daily on week days.
Initial download of the metrics may take a while.