Fig. 12.
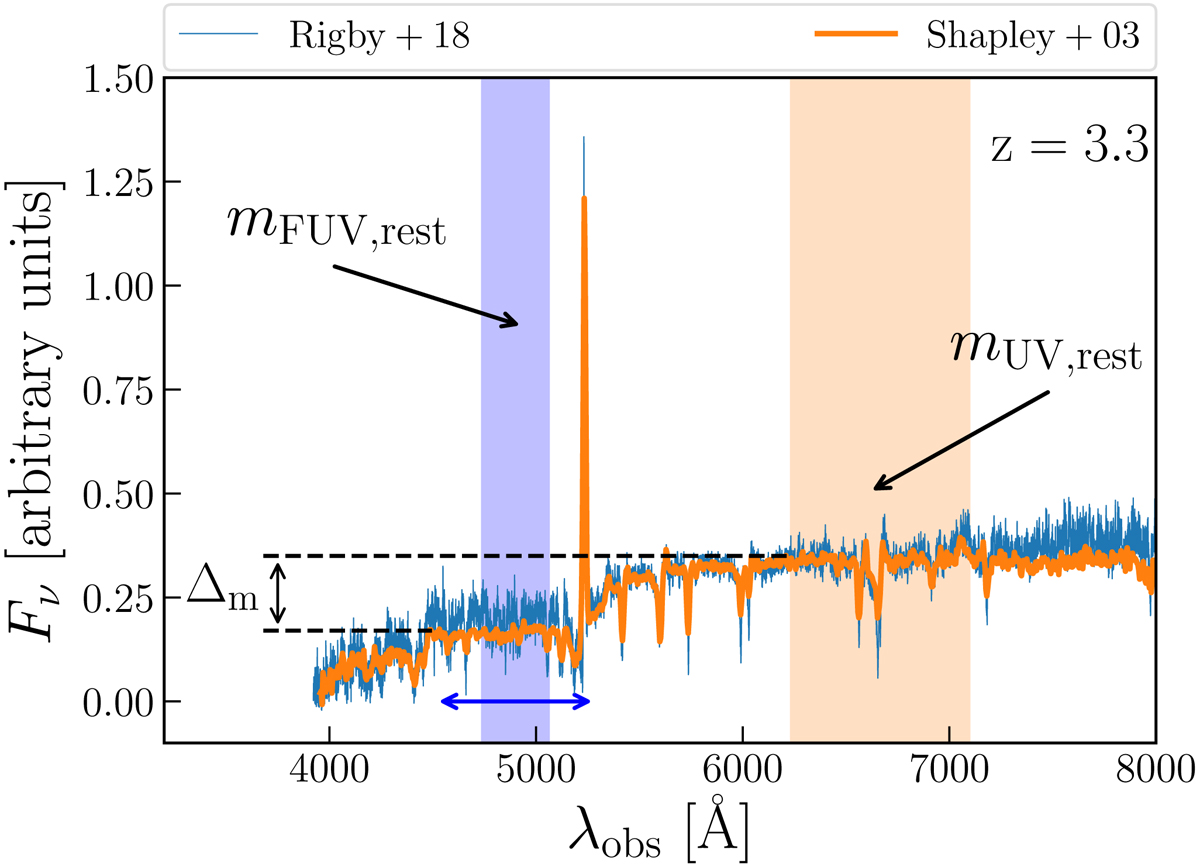
Illustration of the Δm correction (see Sect. 3.1.3 for details) for a galaxy at z = 3.3. For a galaxy of certain brightness mUV, rest, we use this spectrum (Shapley et al. 2003) to estimate the expected brightness in the far UV part of the spectrum. The blue and orange shaded regions indicate spectral ranges for which mFUV, rest and mUV, rest are measured. The blue arrow indicates the spectral range that is simulated in the simulation when mFUV, rest is estimated. For comparison, we also show the stacked spectrum of intermediate resolution by Rigby et al. (2018).
Current usage metrics show cumulative count of Article Views (full-text article views including HTML views, PDF and ePub downloads, according to the available data) and Abstracts Views on Vision4Press platform.
Data correspond to usage on the plateform after 2015. The current usage metrics is available 48-96 hours after online publication and is updated daily on week days.
Initial download of the metrics may take a while.