Fig. 1.
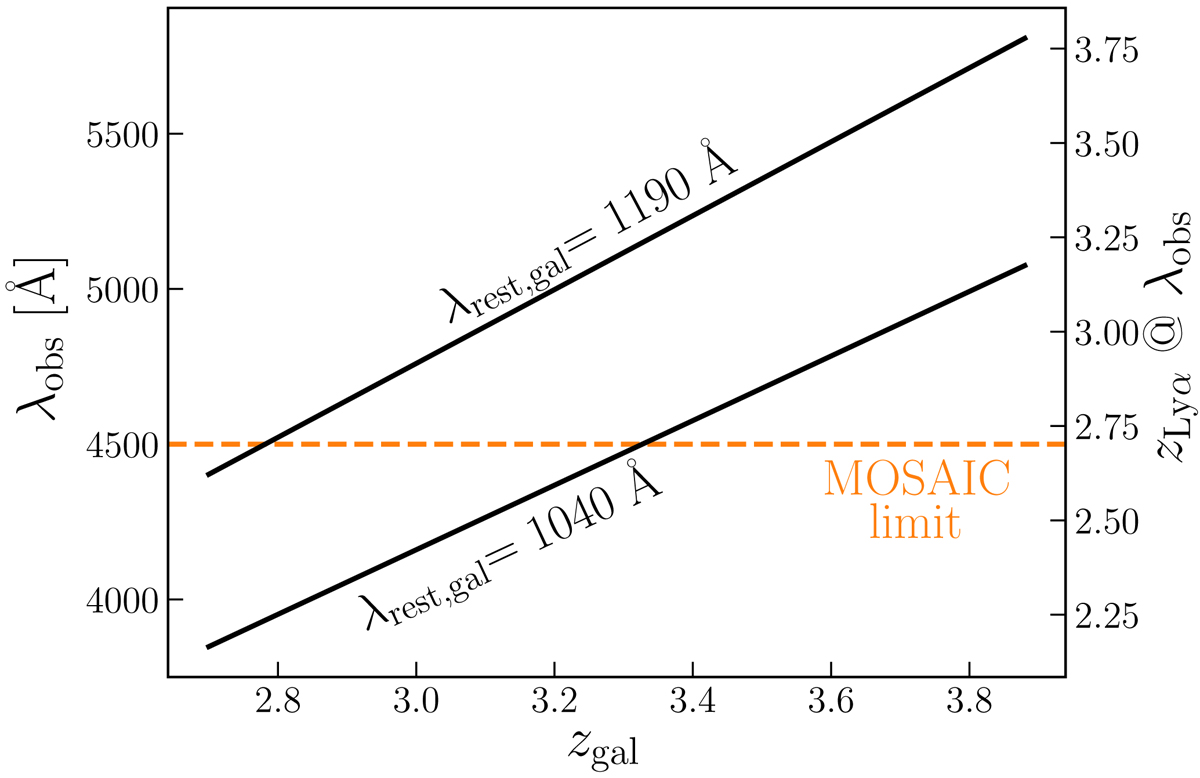
Redshift range to be considered in our simulations. The x-axis shows the redshift of a background LBG zgal, the left y-axis shows the observed wavelength range. The two black lines show the observed wavelengths of the rest-frame 1040−1190 Å range for each zgal, i.e., the wavelength range of Lyα forest. The right y-axis shows the redshift of a Lyα absorber detected at the corresponding observed wavelength. The orange dashed line indicates the currently planned blue wavelength limit of the instrument.
Current usage metrics show cumulative count of Article Views (full-text article views including HTML views, PDF and ePub downloads, according to the available data) and Abstracts Views on Vision4Press platform.
Data correspond to usage on the plateform after 2015. The current usage metrics is available 48-96 hours after online publication and is updated daily on week days.
Initial download of the metrics may take a while.