Fig. B.1
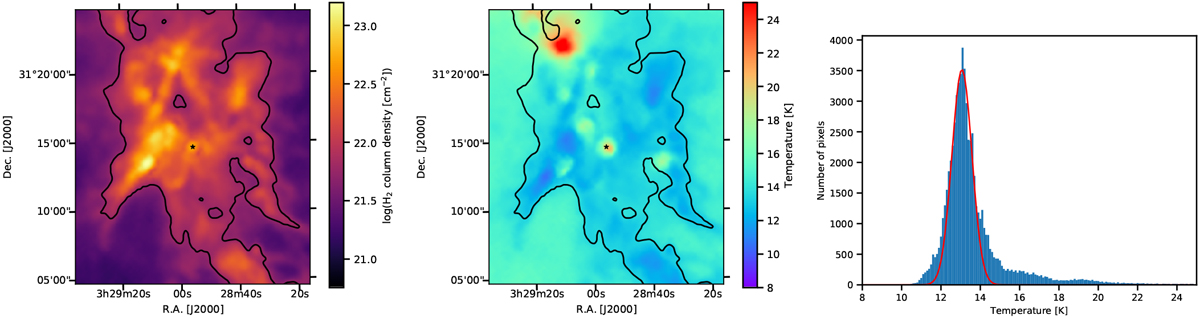
H2 column density (left), dust temperature (centre) maps, and dust temperature histogram of the map pixels with AV > 3 mag (right) of the NGC 1333 star-forming region surrounding IRAS 2A as observed with the Herschel Space Observatory by the Gould Belt survey (André et al. 2010). The black contour in the maps depicts the 3 mag level. The red curve in the histogram depicts the Gaussian fit of the histogram around the histogram peak.
Current usage metrics show cumulative count of Article Views (full-text article views including HTML views, PDF and ePub downloads, according to the available data) and Abstracts Views on Vision4Press platform.
Data correspond to usage on the plateform after 2015. The current usage metrics is available 48-96 hours after online publication and is updated daily on week days.
Initial download of the metrics may take a while.