Fig. 6
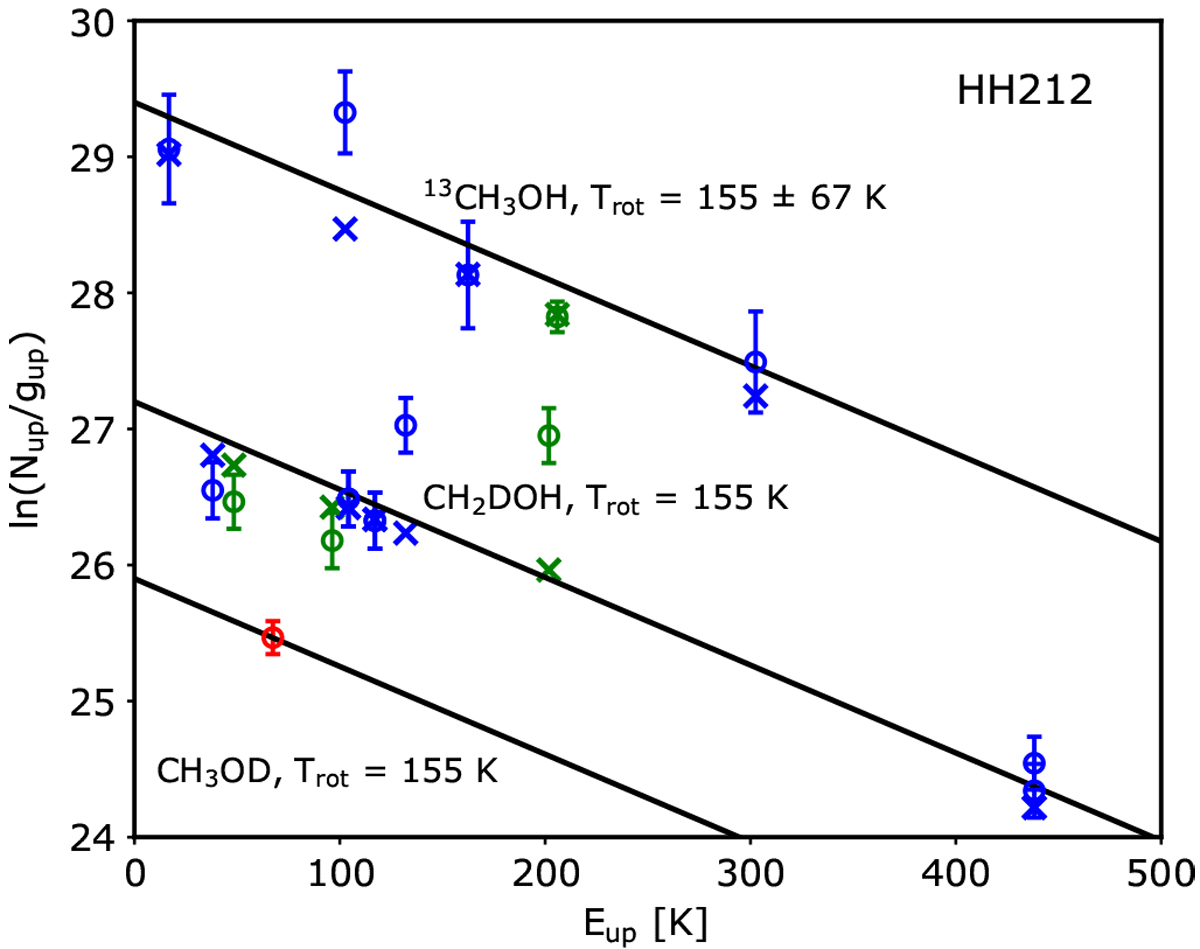
Rotational and population diagrams of methanol isotopologues (13CH3OH, CH2 DOH, and CH3OD) derived towards HH212 for the source sizes derived from the ALMA Cycle 4 data (0′′.19; see Bianchi et al. 2017). The CH2DOH and CH3OD levels have been artificially shifted by −3 for clarity. Red, green, and blue symbols represent transitions at 335, 338, and 349 GHz, respectively. Observational data are depictedby diamonds. Crosses show the best fit of the PD to the data. Black straight lines represent the best fit of the rotational diagram analysis to the data, assuming optically thin emission.
Current usage metrics show cumulative count of Article Views (full-text article views including HTML views, PDF and ePub downloads, according to the available data) and Abstracts Views on Vision4Press platform.
Data correspond to usage on the plateform after 2015. The current usage metrics is available 48-96 hours after online publication and is updated daily on week days.
Initial download of the metrics may take a while.