Fig. 5
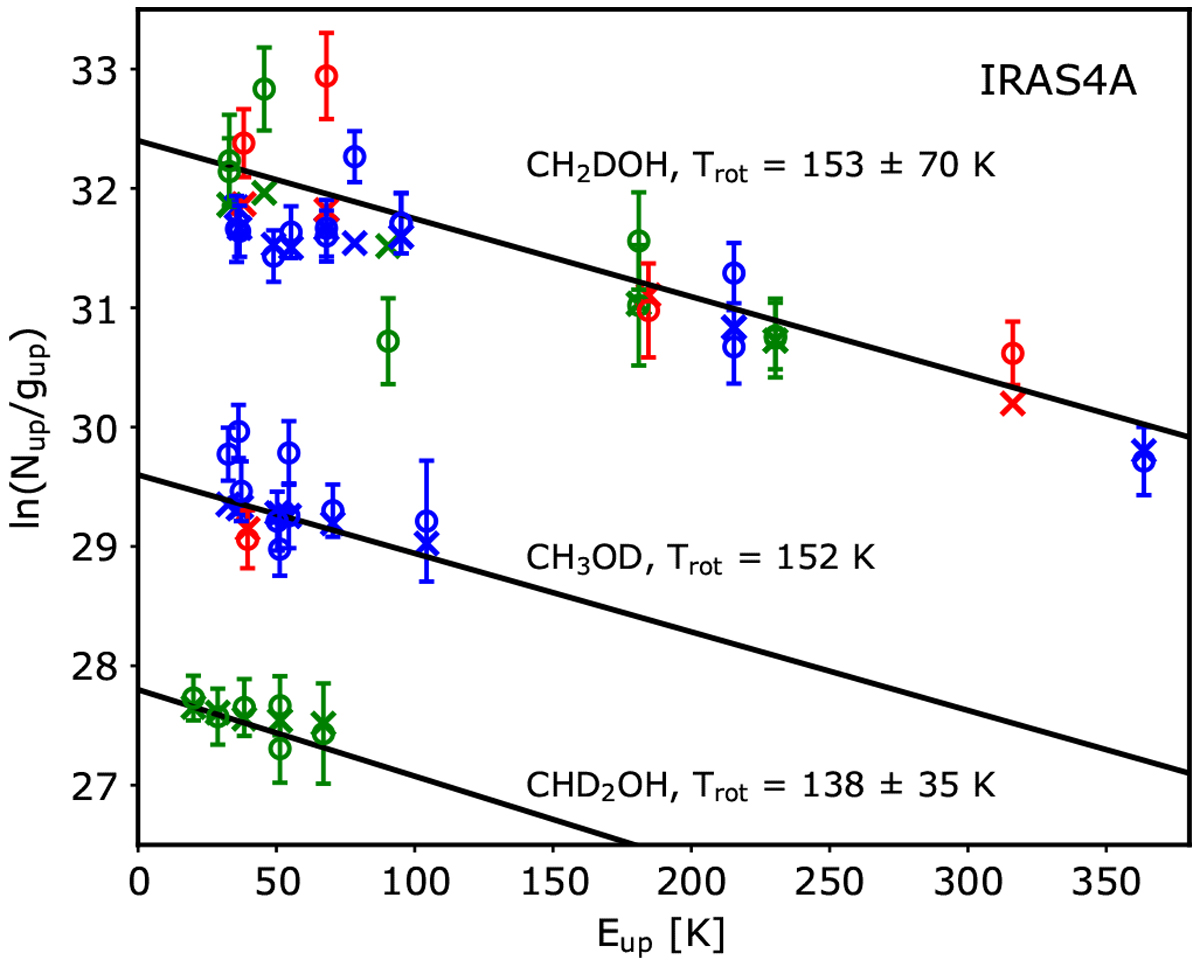
Rotational and population diagrams of deuterated methanol isotopologues (CH2 DOH, CH3 OD, and CHD2OH) derived towards NGC 1333-IRAS 2A for source sizes derived from the PD analysis of the methanol population distribution (0′′.20; see Taquet et al. 2015). Red, green, and blue symbols represent transitions at 145, 165, and 225 GHz, respectively. The CH3 OD and CHD2OH levels have been artificially shifted by −1.5 and −4 for clarity. Observational data are depicted by diamonds. Crosses show the best fit of the PD to the data. Blue and green symbols represent transitions at 2 and 1.3 mm, respectively. Error bars are derived assuming a calibration uncertainty of 20% in addition to the statistical error. Black straight lines represent the best fit of the rotational diagram analysis to the data, assuming optically thin emission.
Current usage metrics show cumulative count of Article Views (full-text article views including HTML views, PDF and ePub downloads, according to the available data) and Abstracts Views on Vision4Press platform.
Data correspond to usage on the plateform after 2015. The current usage metrics is available 48-96 hours after online publication and is updated daily on week days.
Initial download of the metrics may take a while.