Fig. 3
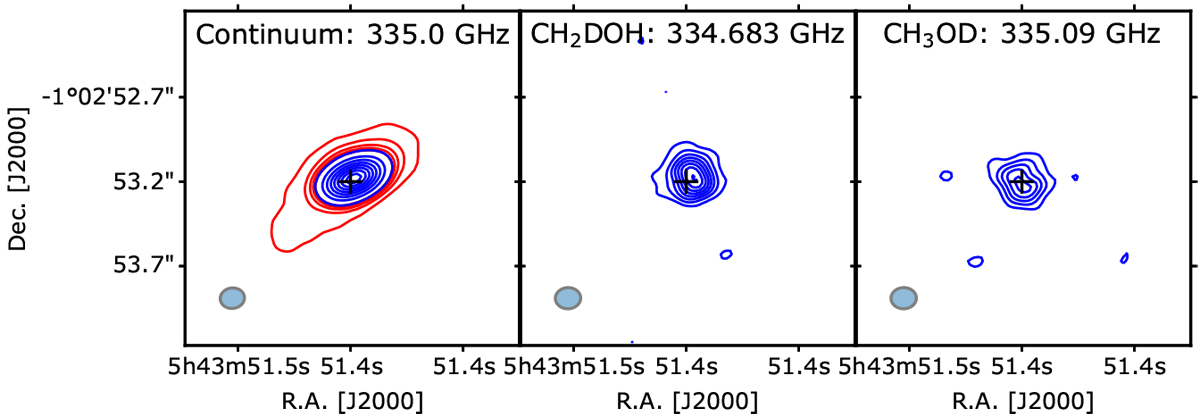
Integrated continuum maps, CH2DOH, and CH3OD emission observed towards HH212 for the ALMA frequency setting at 335 GHz. For the continuum map, red contours show the 5 first 20σ levels and blue contours are in steps of 100σ. For the molecular maps, blue contours are in steps of 3σ. The synthesised beams are shown in the bottom left corner of each panel.
Current usage metrics show cumulative count of Article Views (full-text article views including HTML views, PDF and ePub downloads, according to the available data) and Abstracts Views on Vision4Press platform.
Data correspond to usage on the plateform after 2015. The current usage metrics is available 48-96 hours after online publication and is updated daily on week days.
Initial download of the metrics may take a while.