Fig. 2
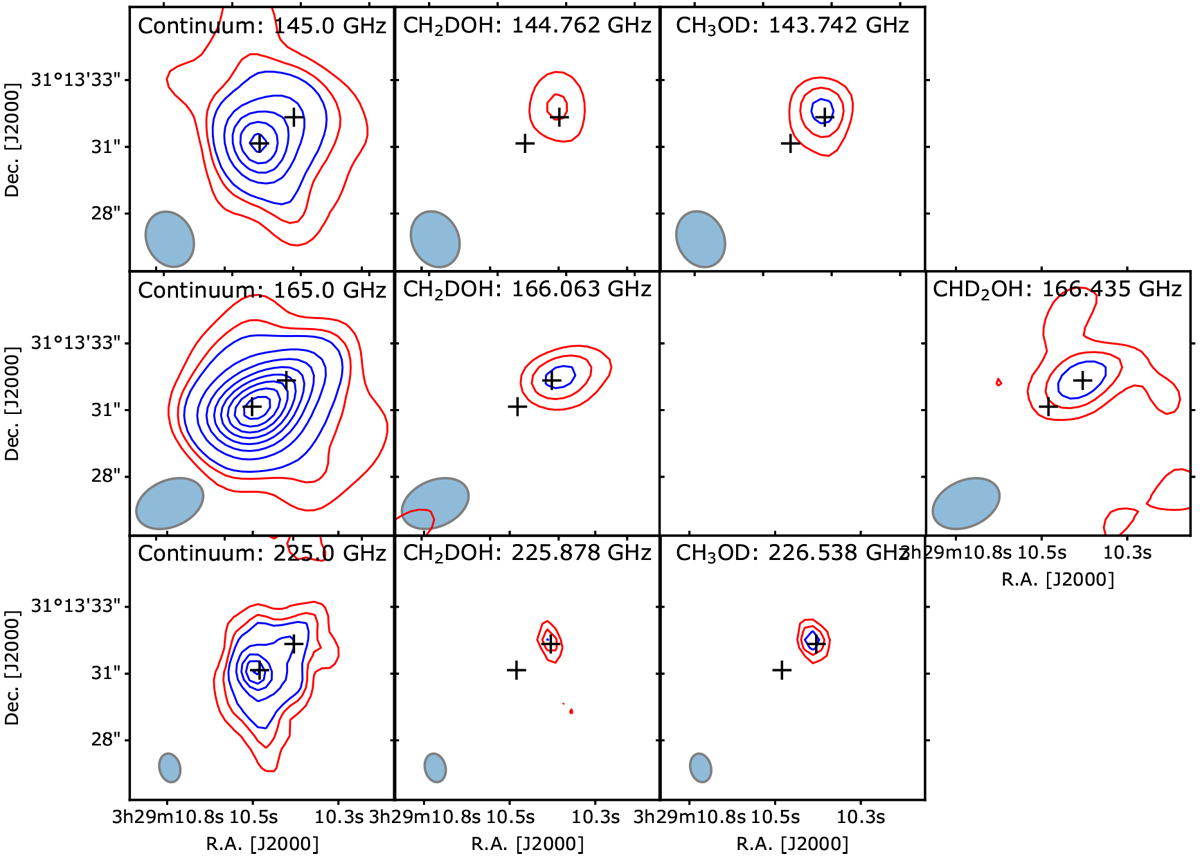
Integrated continuum maps, CH2DOH, CH3 OD, and CHD2OH emissionobserved towards IRAS 4A for the three PdBI frequency settings (top: 145 GHz, middle: 165 GHz, and bottom: 225 GHz). Red contours show the 3σ and 6σ levels, whilstblue contours are in steps of 9σ. The synthesised beams are shown in the bottom left corner of each panel. The black crosses depict the position of the protostars.
Current usage metrics show cumulative count of Article Views (full-text article views including HTML views, PDF and ePub downloads, according to the available data) and Abstracts Views on Vision4Press platform.
Data correspond to usage on the plateform after 2015. The current usage metrics is available 48-96 hours after online publication and is updated daily on week days.
Initial download of the metrics may take a while.