Fig. 3.
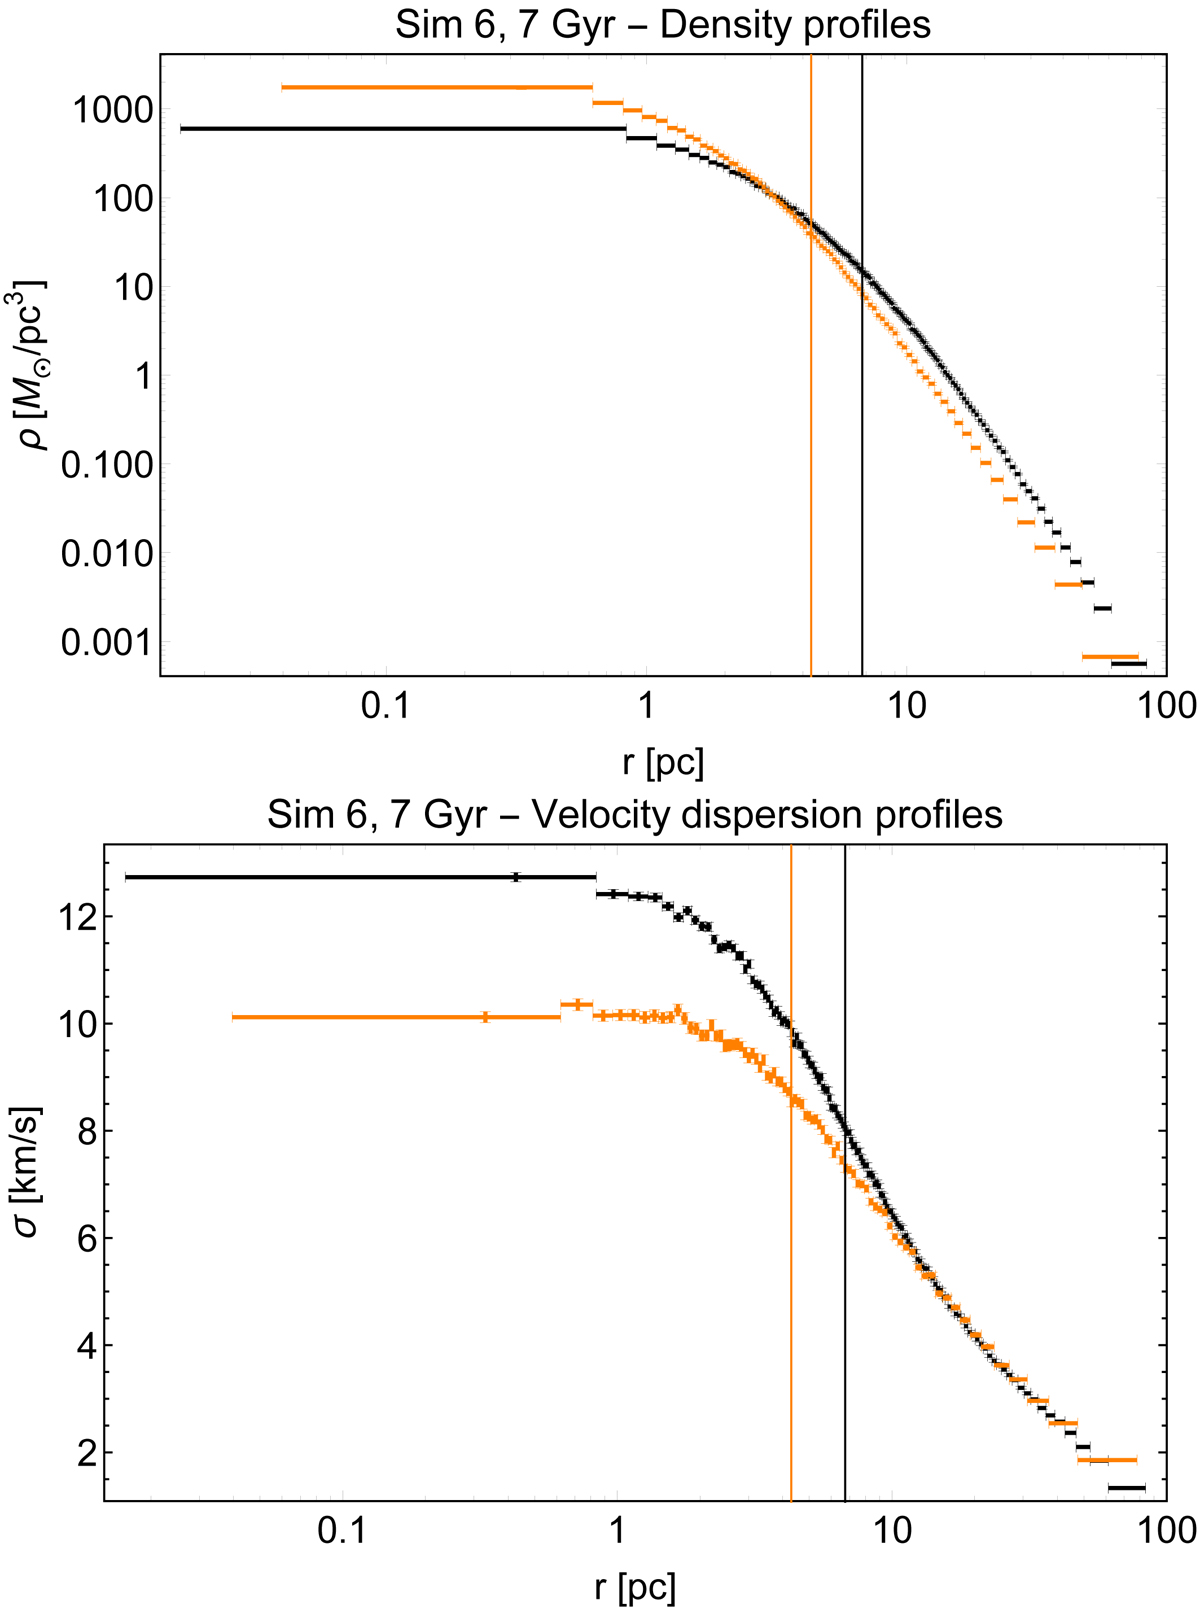
Density (upper panel) and velocity dispersion (lower panel) profiles for light (black) and heavy (orange) component of Sim 6 at 7 Gyr. Uncertainties on the profile values are obtained by means of a bootstrap resampling. The differences between the two density profiles indicate the presence of mass segregation, whereas the differences between the two velocity dispersion profiles may be interpreted as due to the effects of partial energy equipartition. The vertical lines indicate the half-mass radius of the component under consideration.
Current usage metrics show cumulative count of Article Views (full-text article views including HTML views, PDF and ePub downloads, according to the available data) and Abstracts Views on Vision4Press platform.
Data correspond to usage on the plateform after 2015. The current usage metrics is available 48-96 hours after online publication and is updated daily on week days.
Initial download of the metrics may take a while.