Fig. 11.
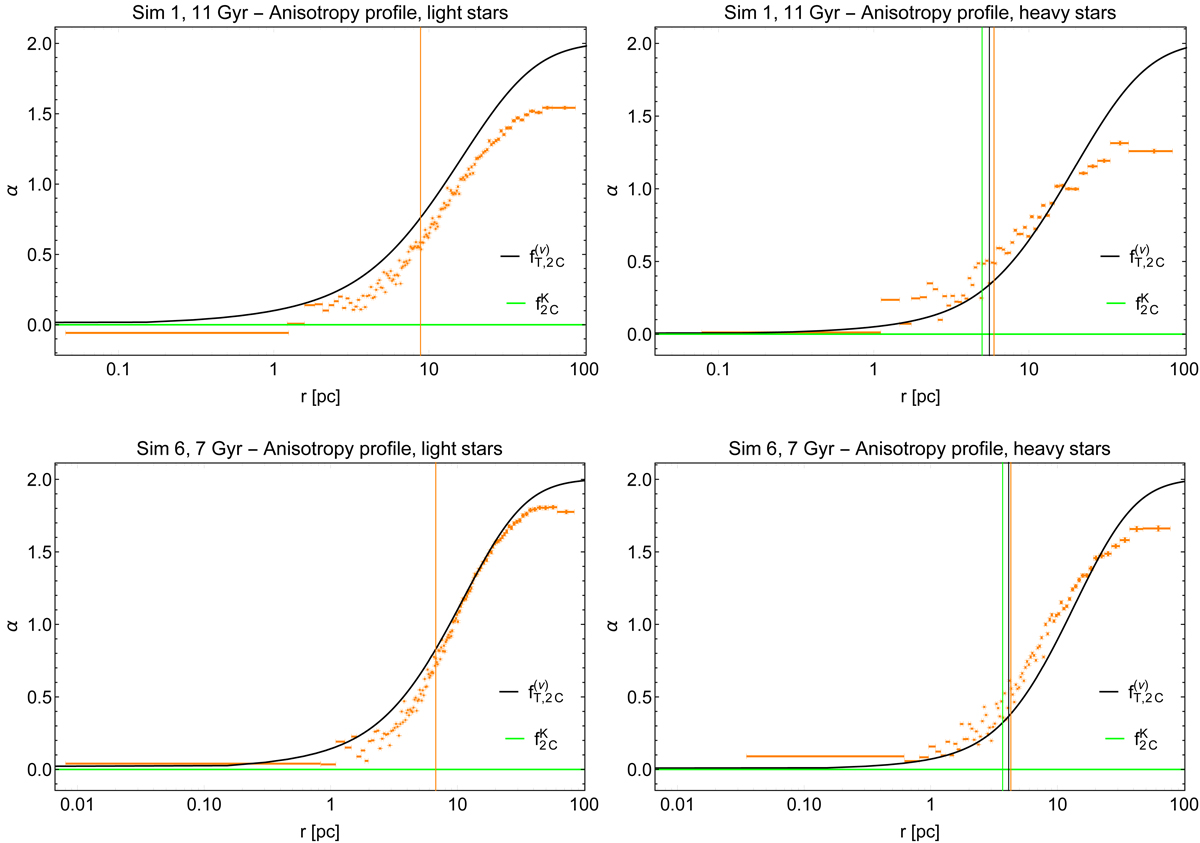
Anisotropy profiles for Sim 1 at 11 Gyr (upper panels) and Sim 6 at 7 Gyr (lower panels) compared to those associated with best-fit two-component ![]() models (black) and the isotropic King models (green). Left panels: anisotropy profiles of light components. Right panels: anisotropy profiles of heavy components. The vertical lines represent the half-mass radius of the component under consideration in the simulated states and in the models.
models (black) and the isotropic King models (green). Left panels: anisotropy profiles of light components. Right panels: anisotropy profiles of heavy components. The vertical lines represent the half-mass radius of the component under consideration in the simulated states and in the models.
Current usage metrics show cumulative count of Article Views (full-text article views including HTML views, PDF and ePub downloads, according to the available data) and Abstracts Views on Vision4Press platform.
Data correspond to usage on the plateform after 2015. The current usage metrics is available 48-96 hours after online publication and is updated daily on week days.
Initial download of the metrics may take a while.