Fig. 3.

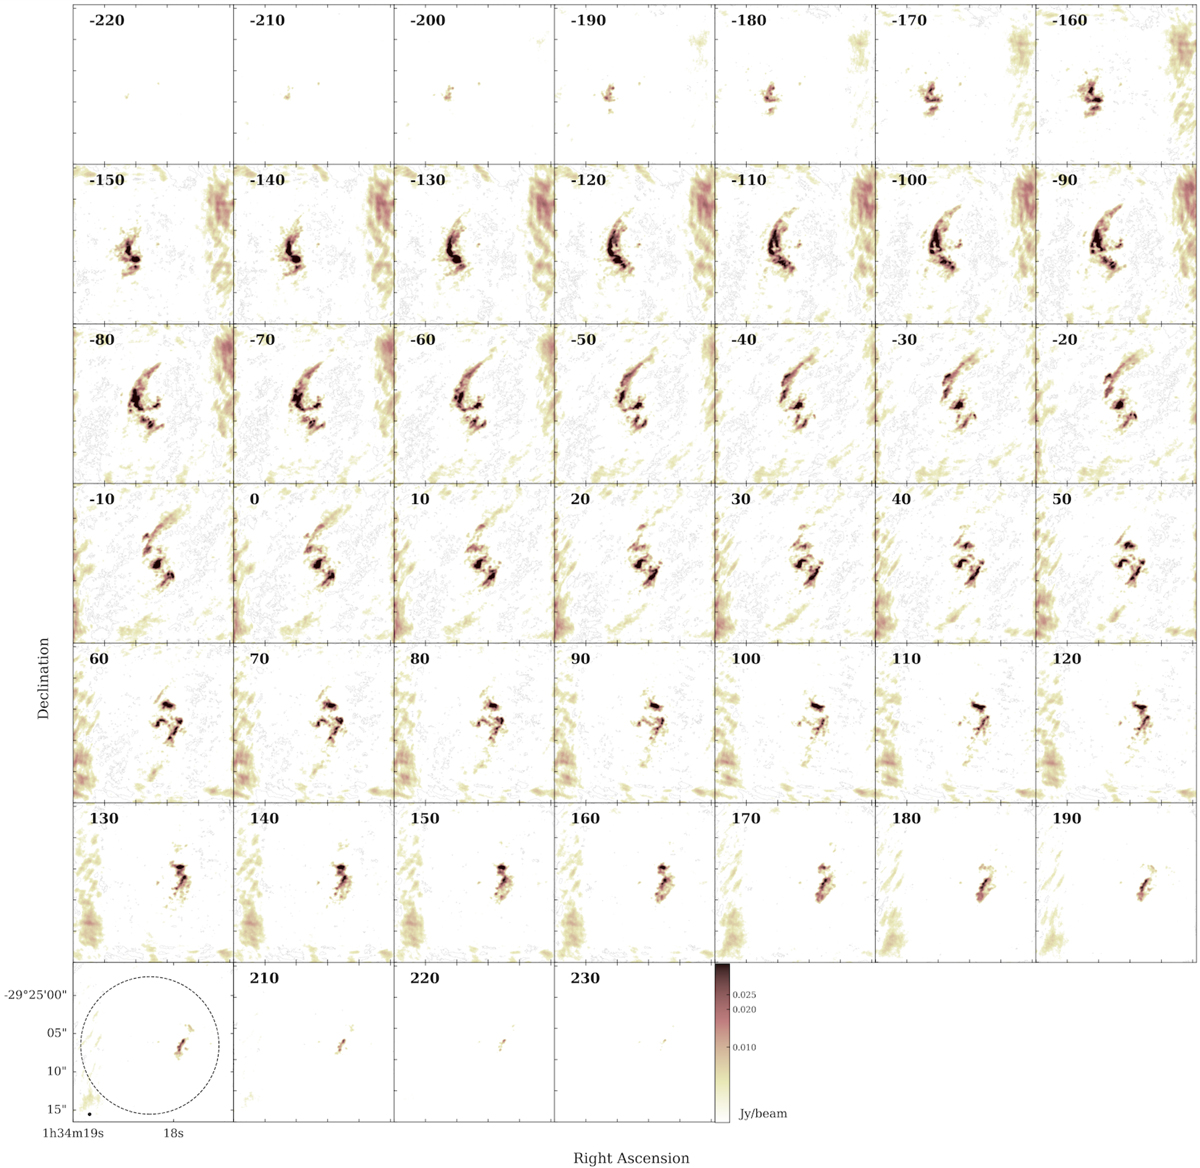
Channel maps of CO(3–2) emission in the center of NGC 613 using the combined observations from ALMA Cycles 3 and 4. We present the channel maps from −220 (top left) to +230 km s−1 (bottom right) relative to the vsys = 1471 km s−1, in steps of 10 km s−1. Each of the 46 square boxes is 21″ × 21″ in size, while the primary beam is 18″ in diameter and is indicated in the dashed circle on the bottom left panel. The synthesized beam (![]() , PA = −69°) is shown in the black ellipse in the bottom left corner. The center of the maps is the phase center of the interferometric observations given in Table 1. The color scale is in power stretch (with a power index of 0.5) ranging between 2 and 38 mJy beam−1.
, PA = −69°) is shown in the black ellipse in the bottom left corner. The center of the maps is the phase center of the interferometric observations given in Table 1. The color scale is in power stretch (with a power index of 0.5) ranging between 2 and 38 mJy beam−1.
Current usage metrics show cumulative count of Article Views (full-text article views including HTML views, PDF and ePub downloads, according to the available data) and Abstracts Views on Vision4Press platform.
Data correspond to usage on the plateform after 2015. The current usage metrics is available 48-96 hours after online publication and is updated daily on week days.
Initial download of the metrics may take a while.


