Fig. 15.

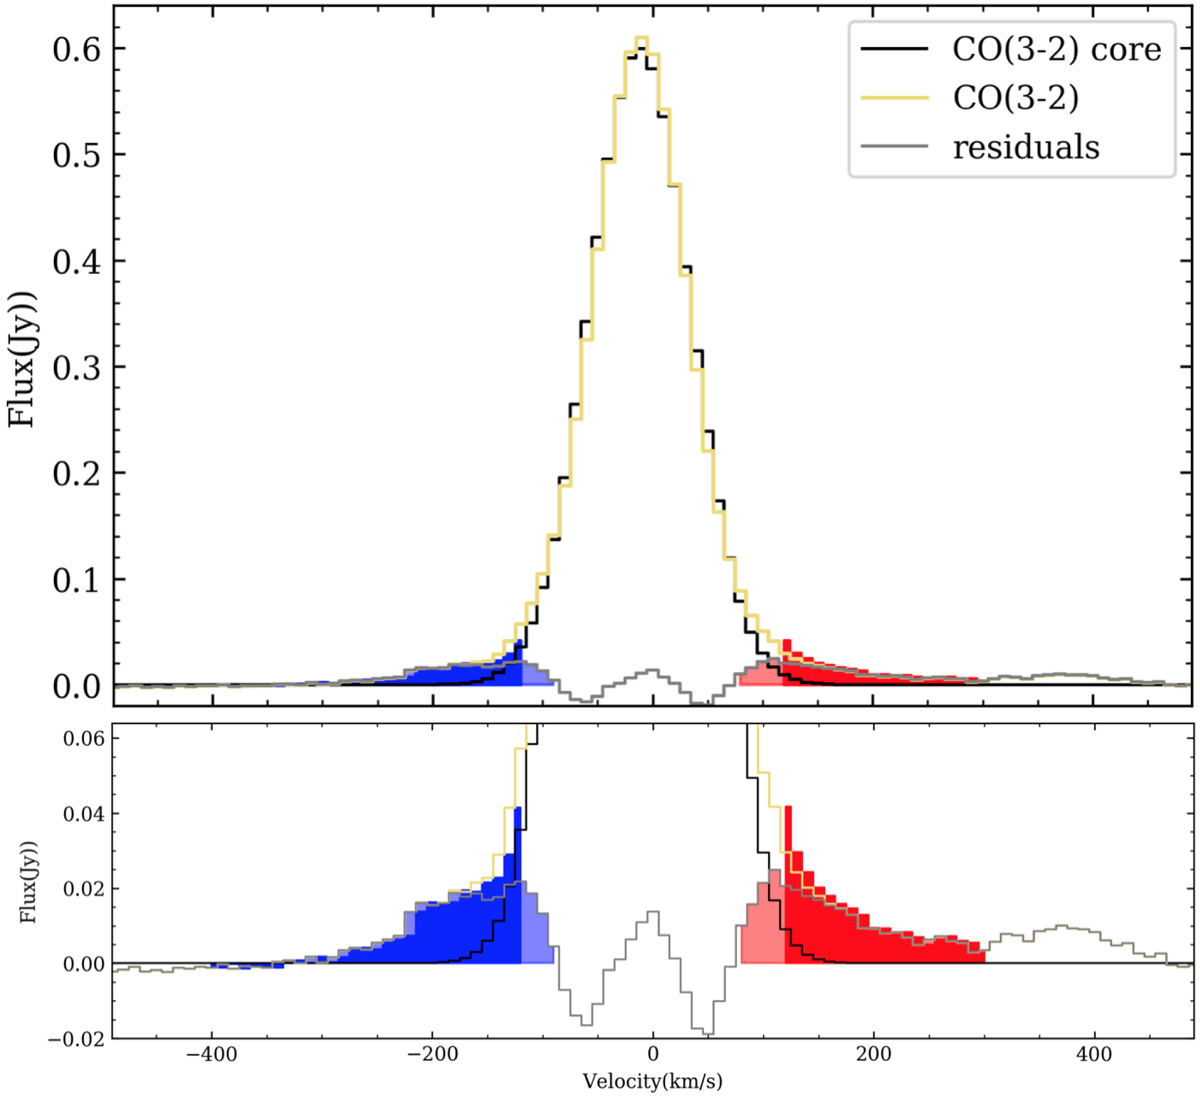
Top panel: nuclear CO(3–2) spectrum in yellow, extracted in a ![]() region. We fit a Gaussian that takes into account the main disk (or “core”) contribution to the CO emission and subtract this from the observed spectrum (residuals in gray). The regions considered in the computation of the molecular outflow properties in the blue and red wings are shown in color. Bottom panel: zoom view of the blue (−400 to −120 km s−1) and red (120 to 300 km s−1) wings. The red wing is integrated only up to +300 km s−1 to avoid the contamination from the H13CN emission at ∼400 km s−1.
region. We fit a Gaussian that takes into account the main disk (or “core”) contribution to the CO emission and subtract this from the observed spectrum (residuals in gray). The regions considered in the computation of the molecular outflow properties in the blue and red wings are shown in color. Bottom panel: zoom view of the blue (−400 to −120 km s−1) and red (120 to 300 km s−1) wings. The red wing is integrated only up to +300 km s−1 to avoid the contamination from the H13CN emission at ∼400 km s−1.
Current usage metrics show cumulative count of Article Views (full-text article views including HTML views, PDF and ePub downloads, according to the available data) and Abstracts Views on Vision4Press platform.
Data correspond to usage on the plateform after 2015. The current usage metrics is available 48-96 hours after online publication and is updated daily on week days.
Initial download of the metrics may take a while.


