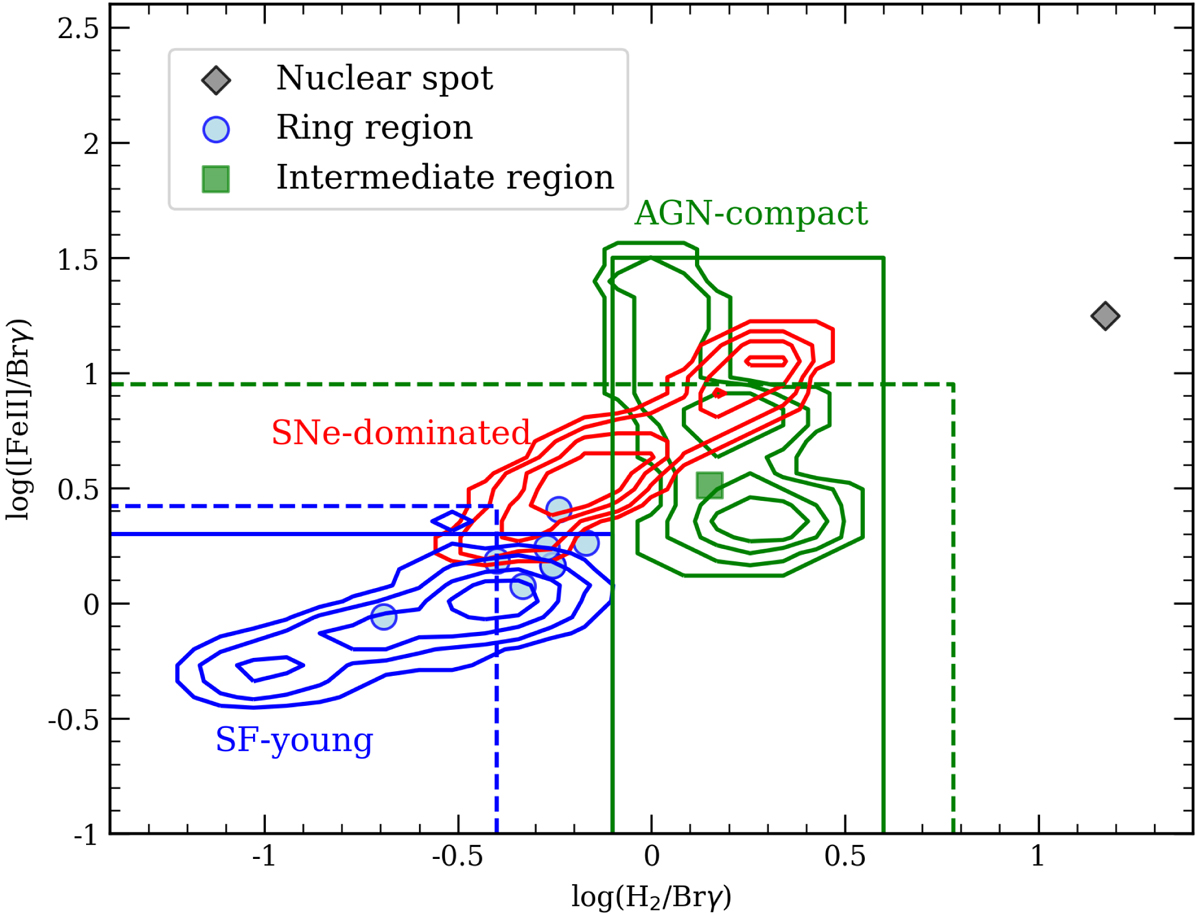
Fig. 14.

Diagnostic diagram with the NIR emission line ratios H2(1–0)S(1)λ2.122 μm/Brγ and [Fe II] λ1.644 μm/Brγ proposed by Colina et al. (2015). Apertures in the circumnuclear ring are shown with blue circles and the aperture from the nuclear region is shown by a gray diamond. Contours denote regions for young star formation, supernovae, and compact AGN, while solid lines denote upper limits for young star formation and AGN, both derived from integral field spectroscopy data (Colina et al. 2015). Dashed lines denote upper limits for star formation and AGN derived from slit spectroscopy (Riffel et al. 2013).
Current usage metrics show cumulative count of Article Views (full-text article views including HTML views, PDF and ePub downloads, according to the available data) and Abstracts Views on Vision4Press platform.
Data correspond to usage on the plateform after 2015. The current usage metrics is available 48-96 hours after online publication and is updated daily on week days.
Initial download of the metrics may take a while.


