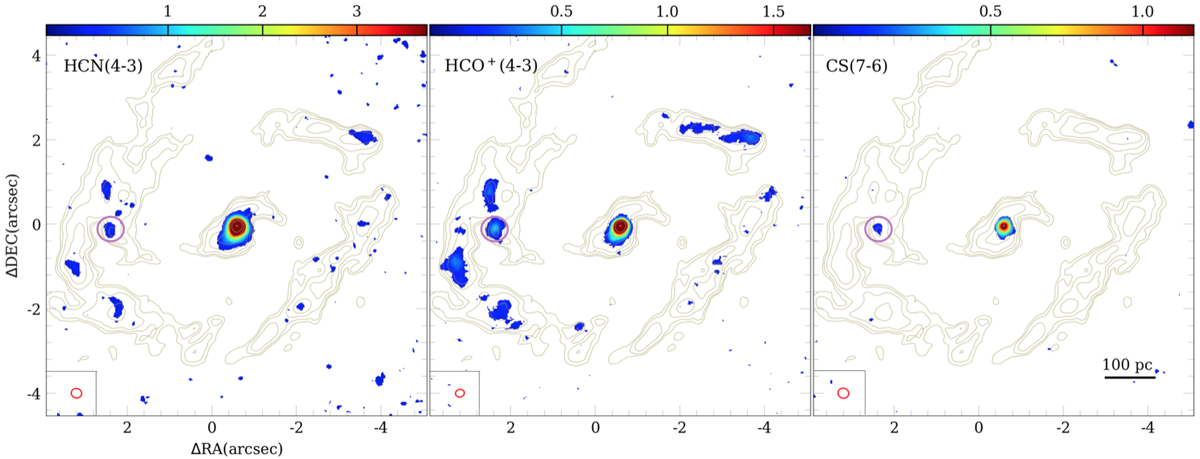
Fig. 10.

Integrated intensity maps of the dense gas tracers HCN(4–3), HCO+(4–3), and CS(7–6) in the panels from left to right, with the CO contours overplotted. HCN and HCO+ present clumpy emissions along a radius of ∼3″, coinciding with the star-forming ring. All the dense gas tracers are detected in the very center as nuclear compact decoupled disks, or molecular tori as discussed in Paper I. The purple circles indicate the position of a clump detected in the HCN, HCO+, and CS emission and used to calculate the ratios in the submillimeter diagram in Fig. 12. The synthesized beam sizes are shown in red in the bottom left corner of each panel.
Current usage metrics show cumulative count of Article Views (full-text article views including HTML views, PDF and ePub downloads, according to the available data) and Abstracts Views on Vision4Press platform.
Data correspond to usage on the plateform after 2015. The current usage metrics is available 48-96 hours after online publication and is updated daily on week days.
Initial download of the metrics may take a while.


