Free Access
Fig. 6.
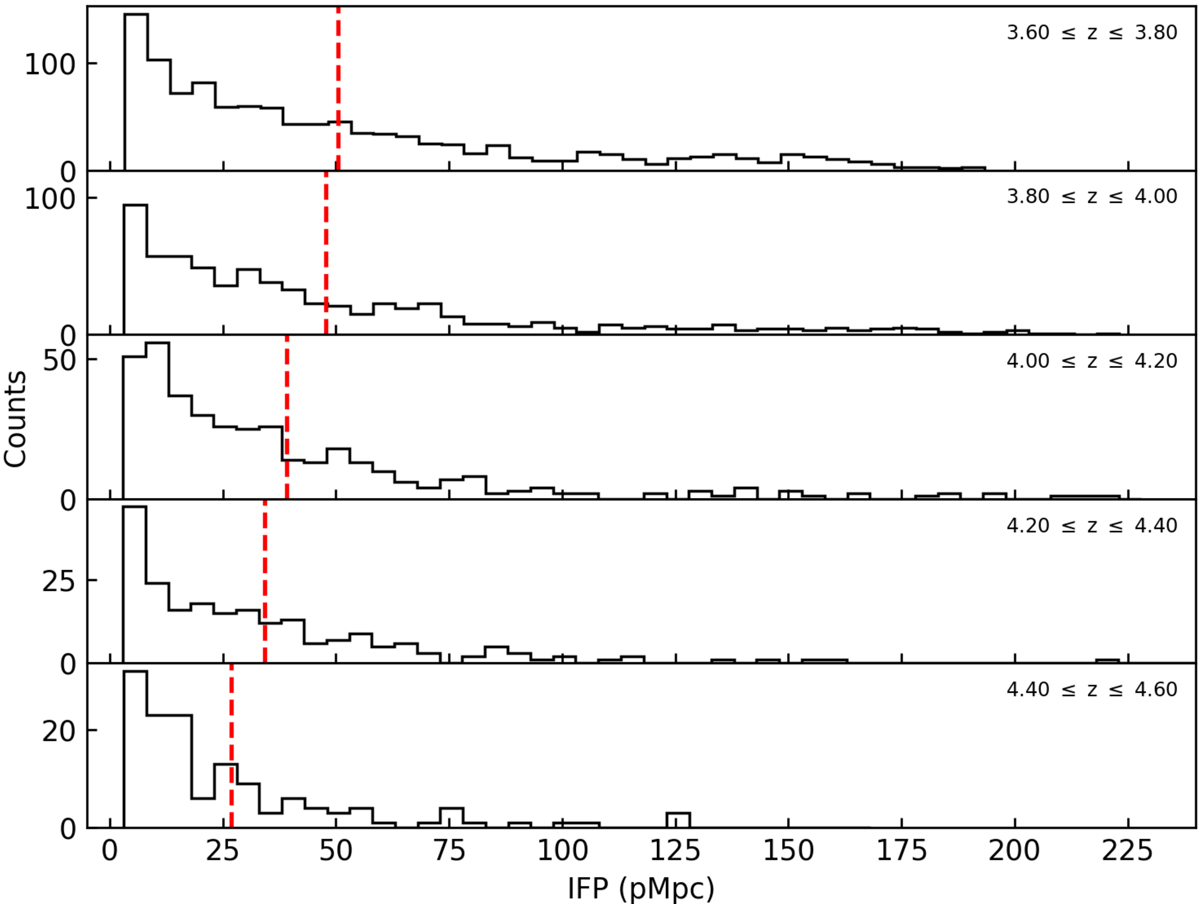
Free path distribution functions for the whole QSO sample at 3.6 ≤ z ≤ 4.6 in redshift bins of Δz = 0.2. The dashed red lines represent the mean value in each redshift bin.
Current usage metrics show cumulative count of Article Views (full-text article views including HTML views, PDF and ePub downloads, according to the available data) and Abstracts Views on Vision4Press platform.
Data correspond to usage on the plateform after 2015. The current usage metrics is available 48-96 hours after online publication and is updated daily on week days.
Initial download of the metrics may take a while.