Fig. 16.
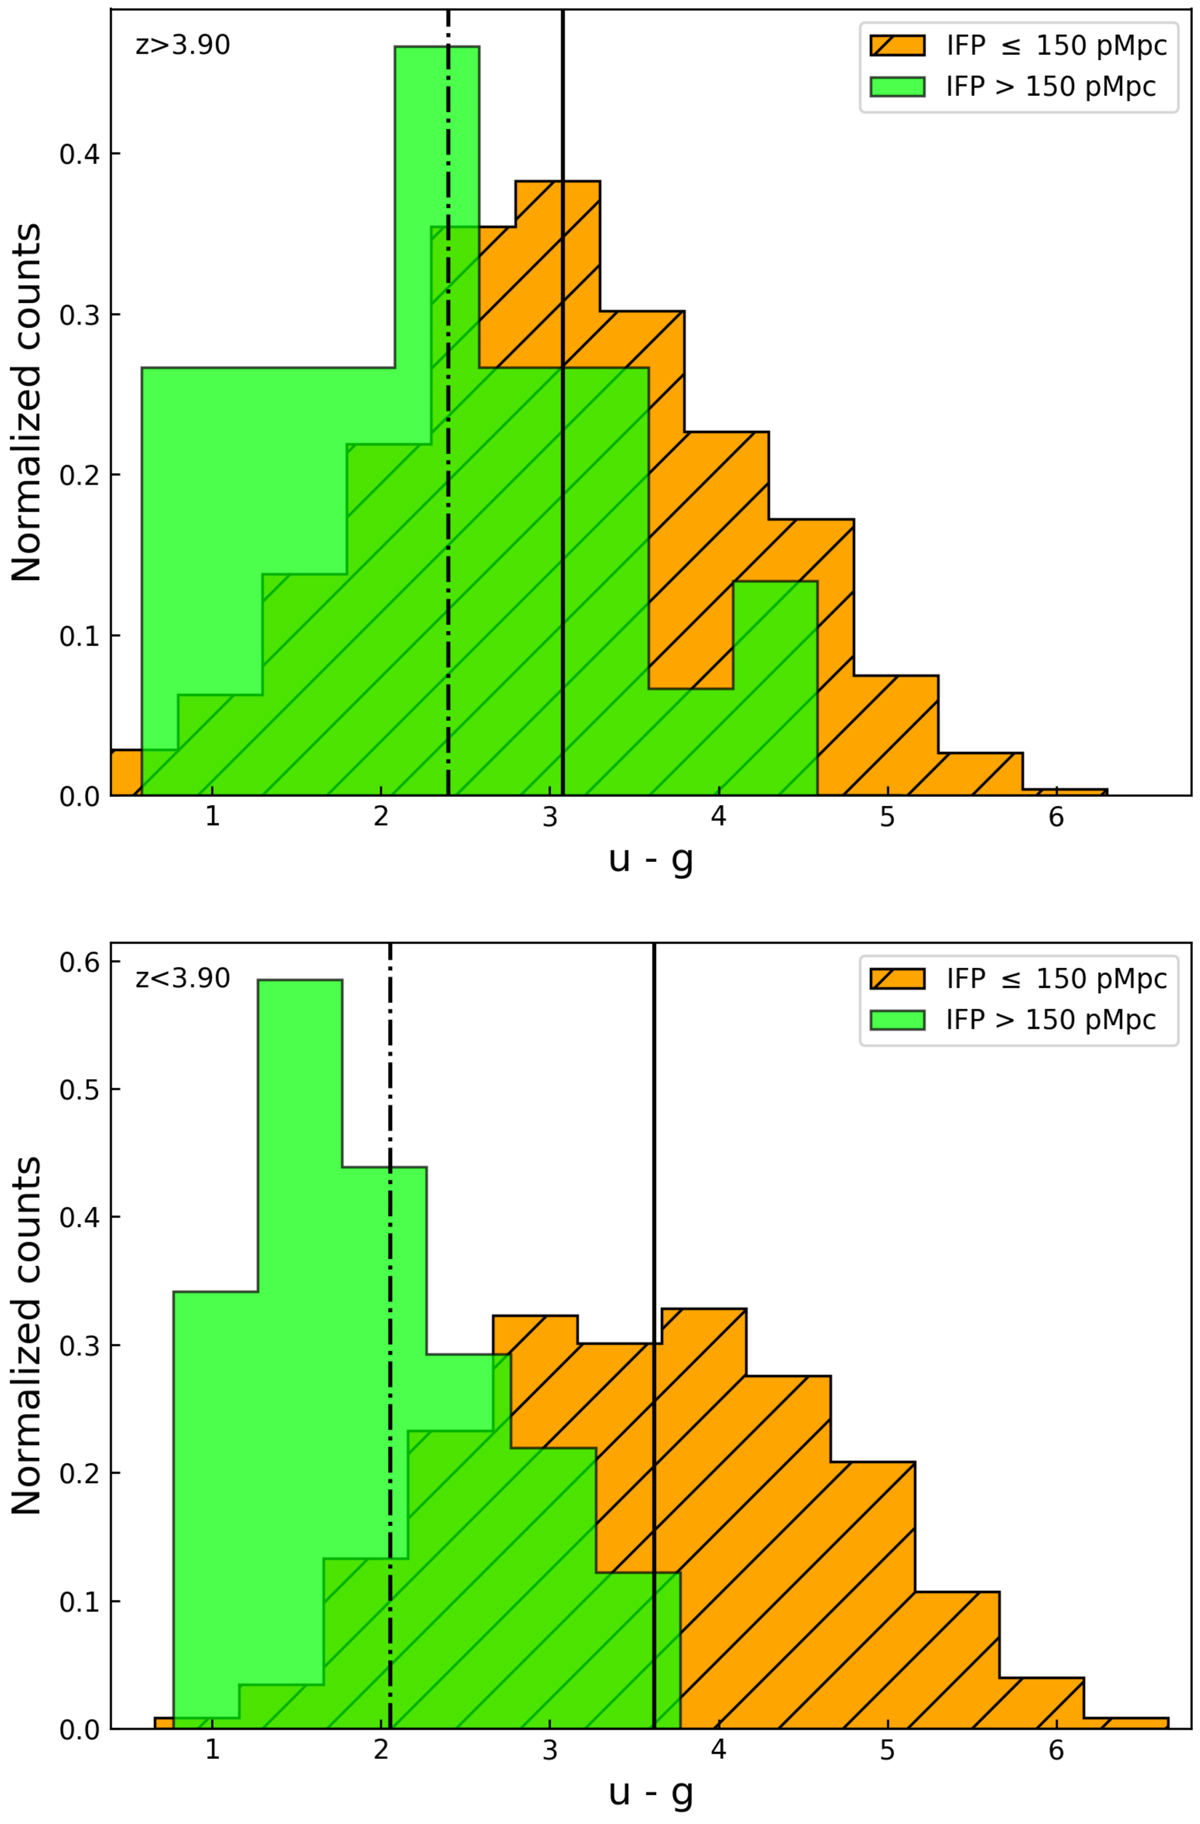
Distribution functions of the u − g color for QSOs with high (green histogram, IFP ≥ 150 pMpc) and low (orange hatched histogram, IFP < 150 pMpc) IFPs. The solid and dot-dashed black lines refer to the average values of the orange and green distributions, respectively. Top (bottom) panel: u − g distributions for QSOs at higher (lower) redshift with respect to the median one at z ∼ 3.90.
Current usage metrics show cumulative count of Article Views (full-text article views including HTML views, PDF and ePub downloads, according to the available data) and Abstracts Views on Vision4Press platform.
Data correspond to usage on the plateform after 2015. The current usage metrics is available 48-96 hours after online publication and is updated daily on week days.
Initial download of the metrics may take a while.