Fig. 14.
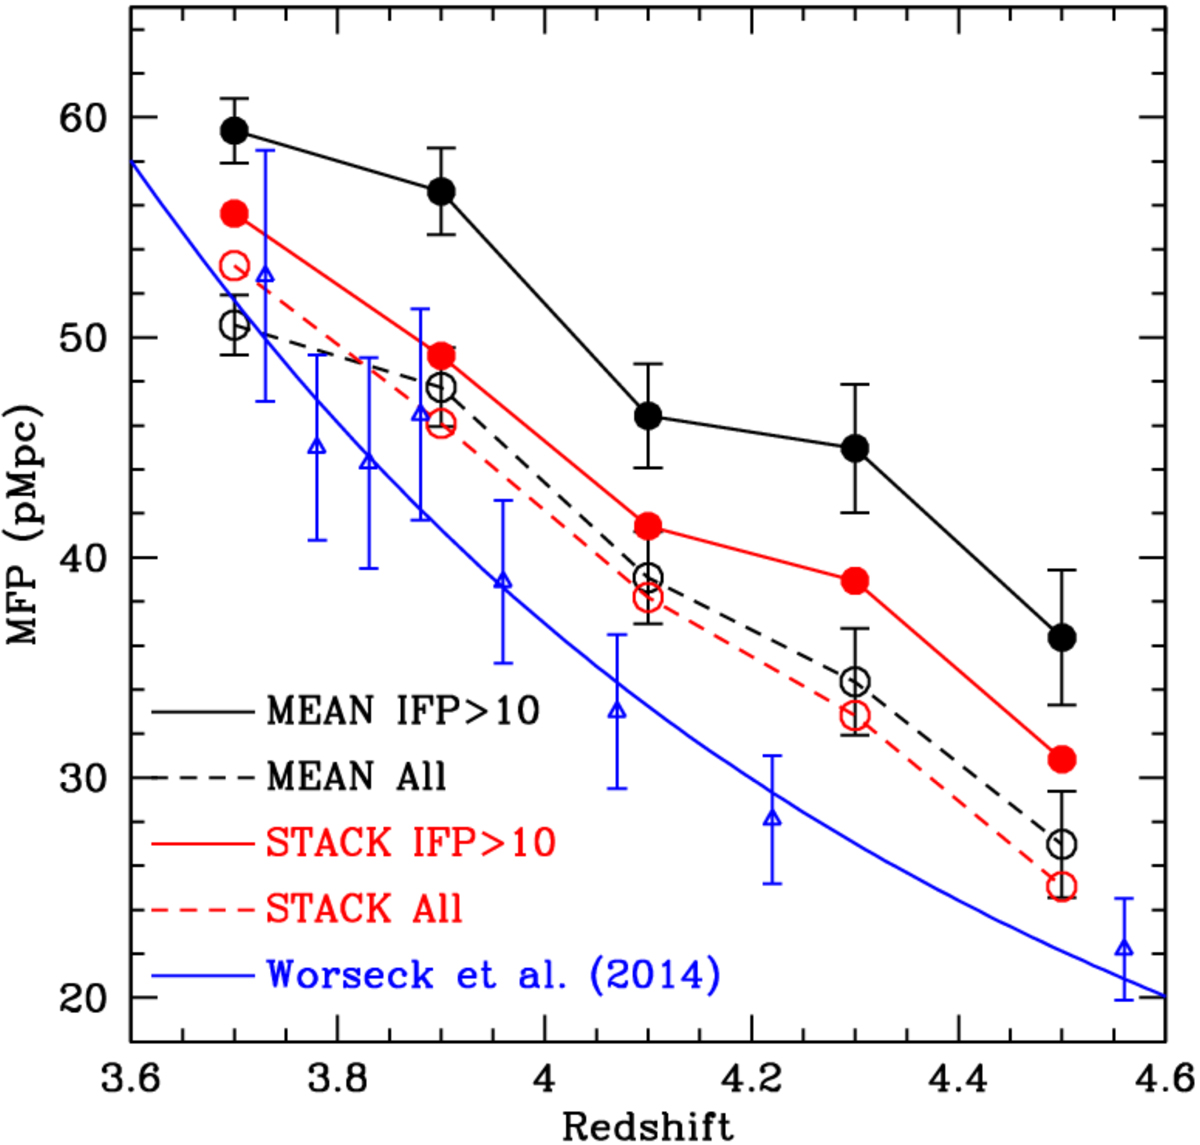
Redshift dependence of the MFP for SDSS QSOs at 3.6 ≤ z ≤ 4.6 and I ≤ 20.0. The filled black points (connected by a continuous black line) summarize the mean value of the free paths excluding objects with IFP ≤ 10 pMpc, which might be affected by AAs (option 2). The open black circles (connected by a dashed black line) show the MFP for all the QSOs of our sample (option 1). The filled red points (connected by a continuous red line) are instead derived from the stack of QSOs with IFP > 10 pMpc, and the open red circles (connected by a dashed red line) show the MFP obtained by the stack of all the QSOs. The dotted blue curve is the evolution of the MFP with redshift found by Worseck et al. (2014), while the blue open triangles indicate their mean values in different redshift bins.
Current usage metrics show cumulative count of Article Views (full-text article views including HTML views, PDF and ePub downloads, according to the available data) and Abstracts Views on Vision4Press platform.
Data correspond to usage on the plateform after 2015. The current usage metrics is available 48-96 hours after online publication and is updated daily on week days.
Initial download of the metrics may take a while.