Fig. 1.
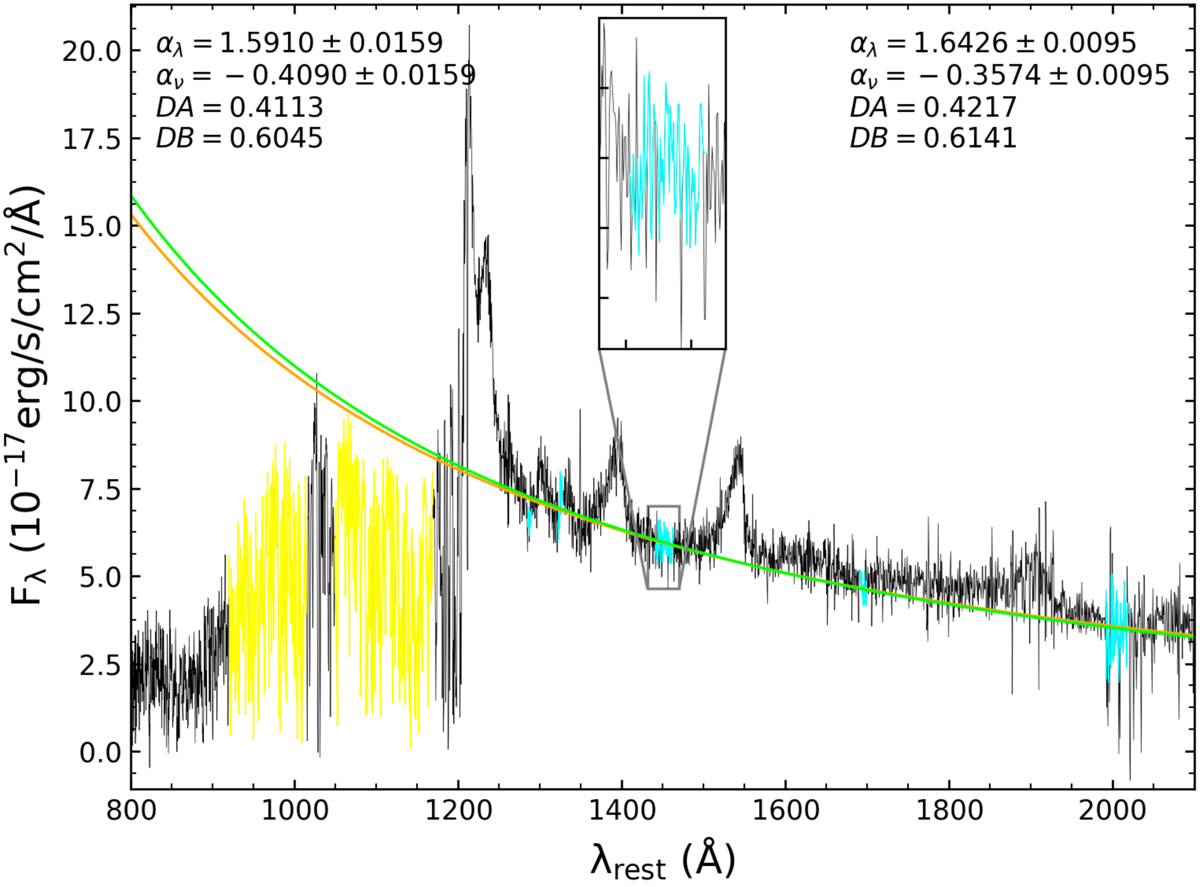
Spectral slope and flux decrements for the QSO SDSS J105340.8+010335.7 at zQSO = 3.66983. The cyan portions of the spectrum are the five windows that are free of emission lines. The yellow regions are the places of the spectrum in which the flux decrements DA and DB have been calculated. The solid orange and green lines represent the fit with and without the first window (1284−1291 Å rest frame), respectively.
Current usage metrics show cumulative count of Article Views (full-text article views including HTML views, PDF and ePub downloads, according to the available data) and Abstracts Views on Vision4Press platform.
Data correspond to usage on the plateform after 2015. The current usage metrics is available 48-96 hours after online publication and is updated daily on week days.
Initial download of the metrics may take a while.