Fig. 4.
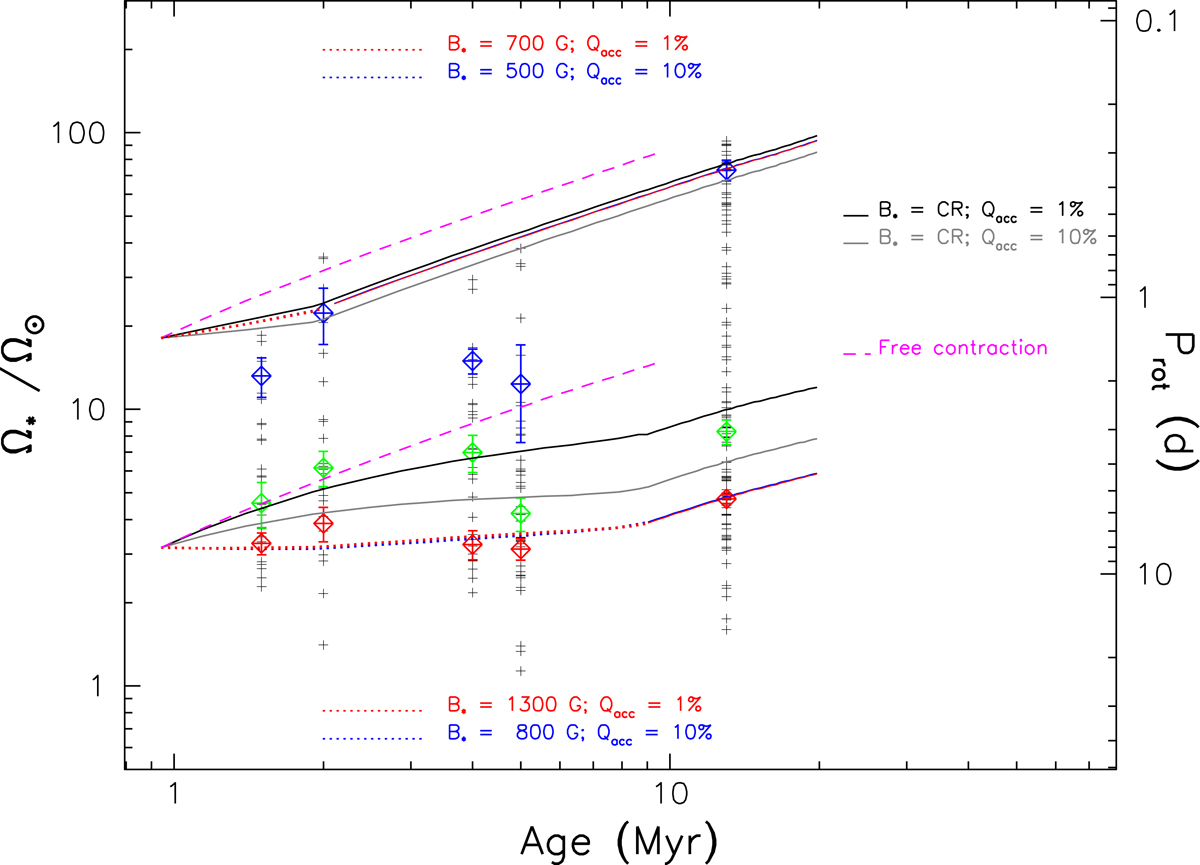
Angular velocity evolution of stellar convective envelope as function of time for fast (up) and slow (down) rotator models in case where Ṁacc,init = 10−9 M⊙ yr−1. The black and the grey solid lines represent the MEs and APSW processes with Qacc = 1% and Qacc = 10%, respectively, and the magnetic field is from the BOREAS routine from Cranmer & Saar (2011). The red and the blue dotted lines represent the models including the MEs and APSW processes with Qacc = 1% and Qacc = 10%, respectively, but with the numerically imposed magnetic field Bmod. The free contraction (i.e. without any external interaction) is shown by the magenta long-dashed line. It represents the increase of the rotation rate during a free contraction phase. The angular velocity is scaled to the angular velocity of the present Sun. The blue and the red tilted square and associated error bars represent, respectively, the 90th percentile and the 25th percentile of the rotational distributions of solar-type stars in star-forming regions and young open clusters obtained with a rejection sampling method described in Gallet & Bouvier (2013).
Current usage metrics show cumulative count of Article Views (full-text article views including HTML views, PDF and ePub downloads, according to the available data) and Abstracts Views on Vision4Press platform.
Data correspond to usage on the plateform after 2015. The current usage metrics is available 48-96 hours after online publication and is updated daily on week days.
Initial download of the metrics may take a while.