Fig. 1.
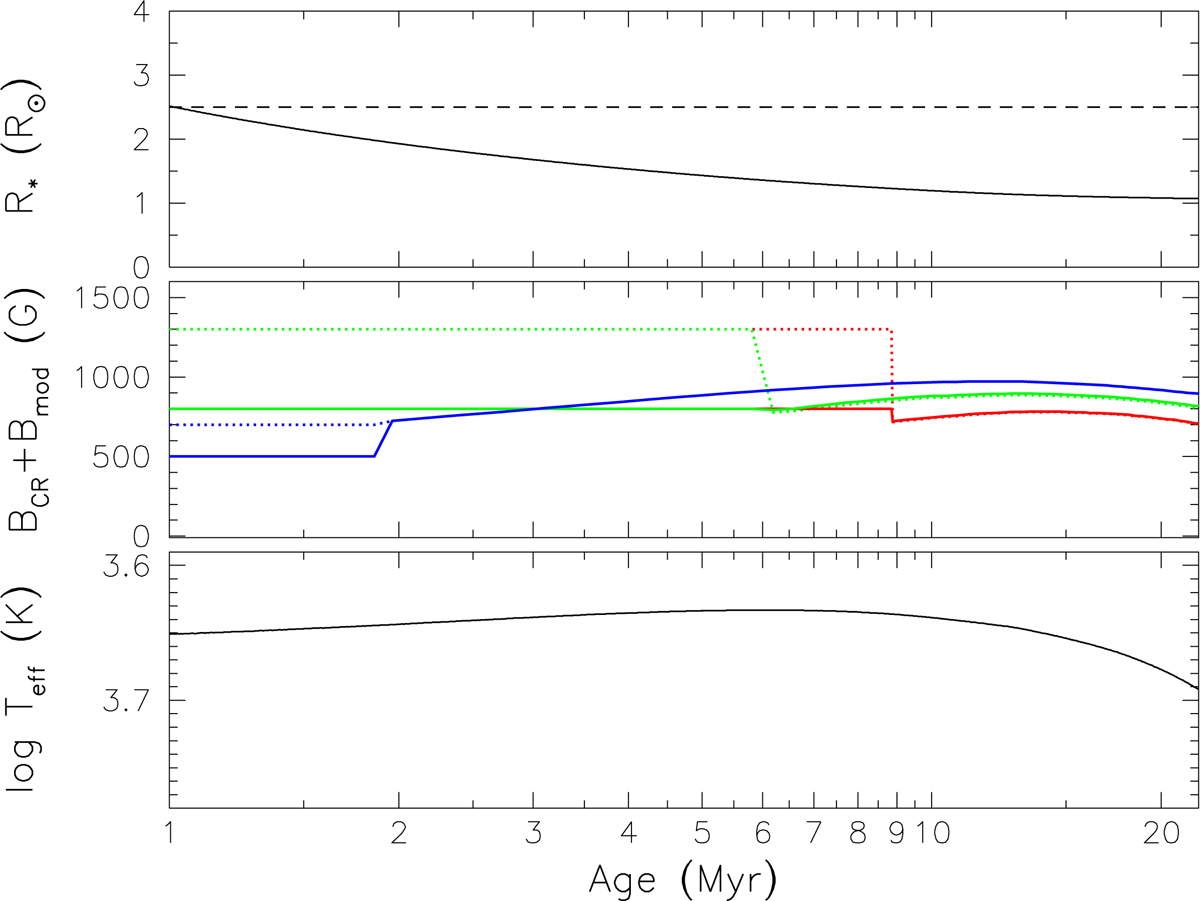
Evolution of stellar radius R⋆ (R⊙) (upper panel), magnetic field BCR + Bmod (G) (middle panel), and effective temperature Teff (K) (lower panel) as function of time. It is for a 1 M⊙ star at solar metallicity and for accretion rate at 1 Myr of Ṁacc,init = 10−9 M⊙ yr−1. The stellar model is from Amard et al. (2019). The dashed line in the upper panel corresponds to R⋆ = 2.5 R⊙. In the middle panel, the colours correspond to the three different initial rotation rates: fast (blue), median (green), and slow (red). The solid lines are for Qacc = 10% and the dotted lines are for Qacc = 1%.
Current usage metrics show cumulative count of Article Views (full-text article views including HTML views, PDF and ePub downloads, according to the available data) and Abstracts Views on Vision4Press platform.
Data correspond to usage on the plateform after 2015. The current usage metrics is available 48-96 hours after online publication and is updated daily on week days.
Initial download of the metrics may take a while.