Fig. 7
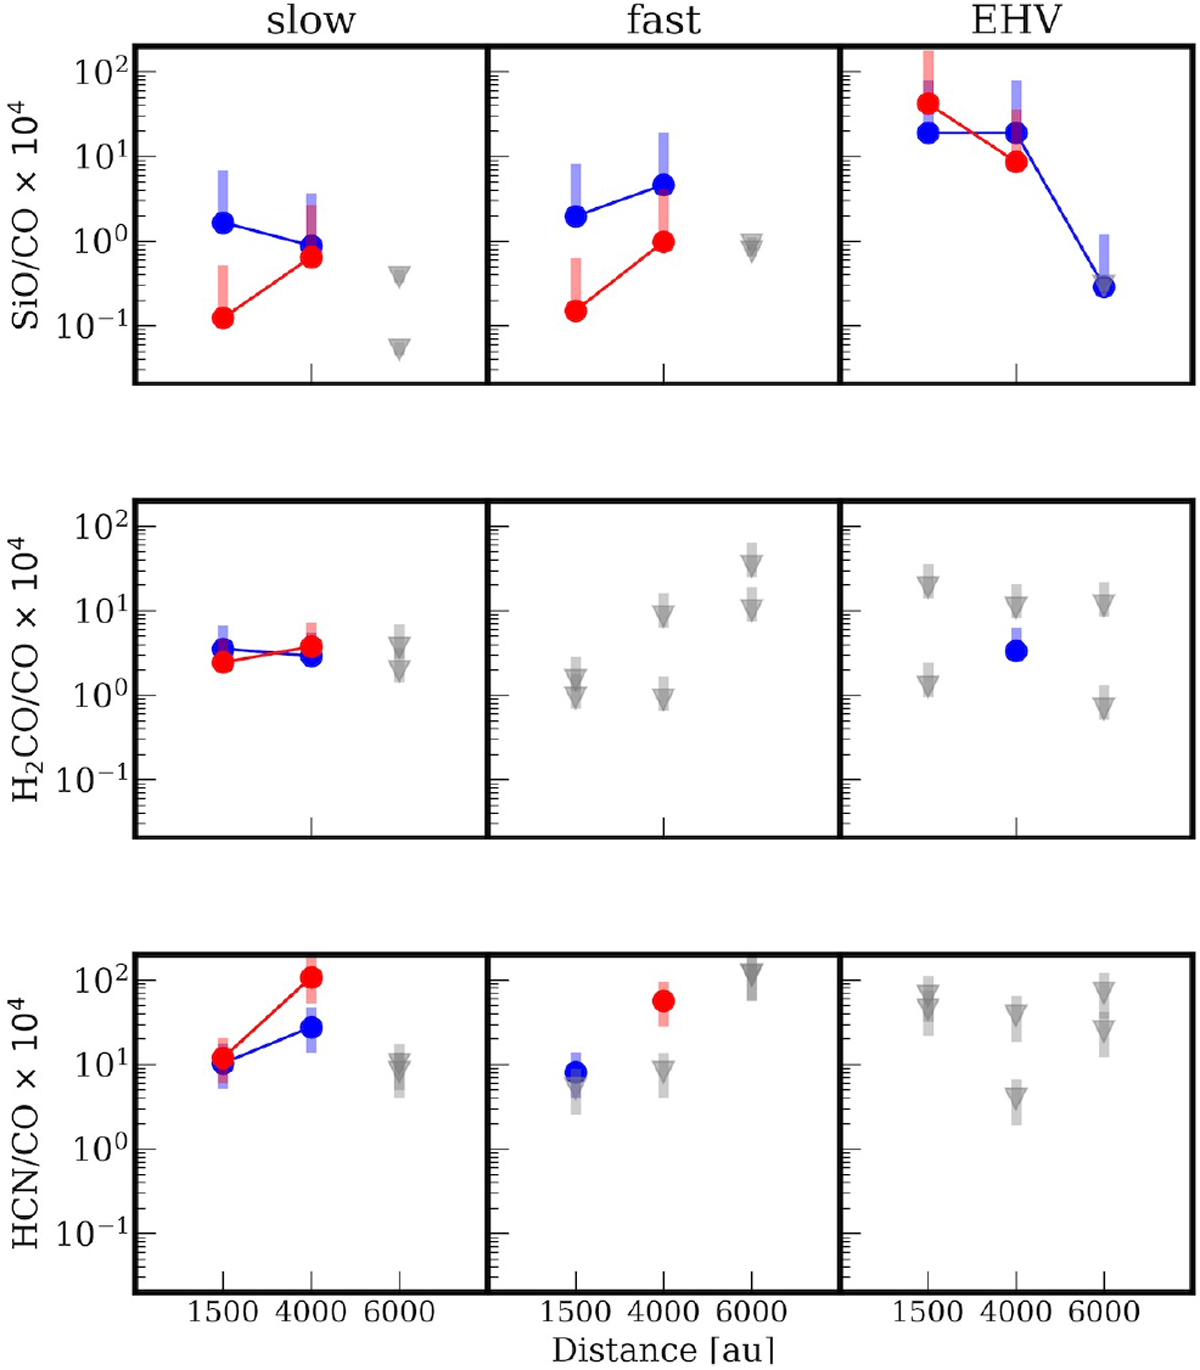
Molecular abundances with respect to CO scaled by 104 for Ser-emb 8 (N). The distance from the protostar is on the x-axis. Panels from left to right are for the slow wing, the fast wing, and the EHV component. The abundances measured for three different regions along the outflow are shown for blueshifted and redshifted parts of the outflow separately. Abundances are measured in the same manner as in Fig. 6. The HCN emission is likely optically thick and therefore the abundance should be treated as a lower limit.
Current usage metrics show cumulative count of Article Views (full-text article views including HTML views, PDF and ePub downloads, according to the available data) and Abstracts Views on Vision4Press platform.
Data correspond to usage on the plateform after 2015. The current usage metrics is available 48-96 hours after online publication and is updated daily on week days.
Initial download of the metrics may take a while.