Fig. 6
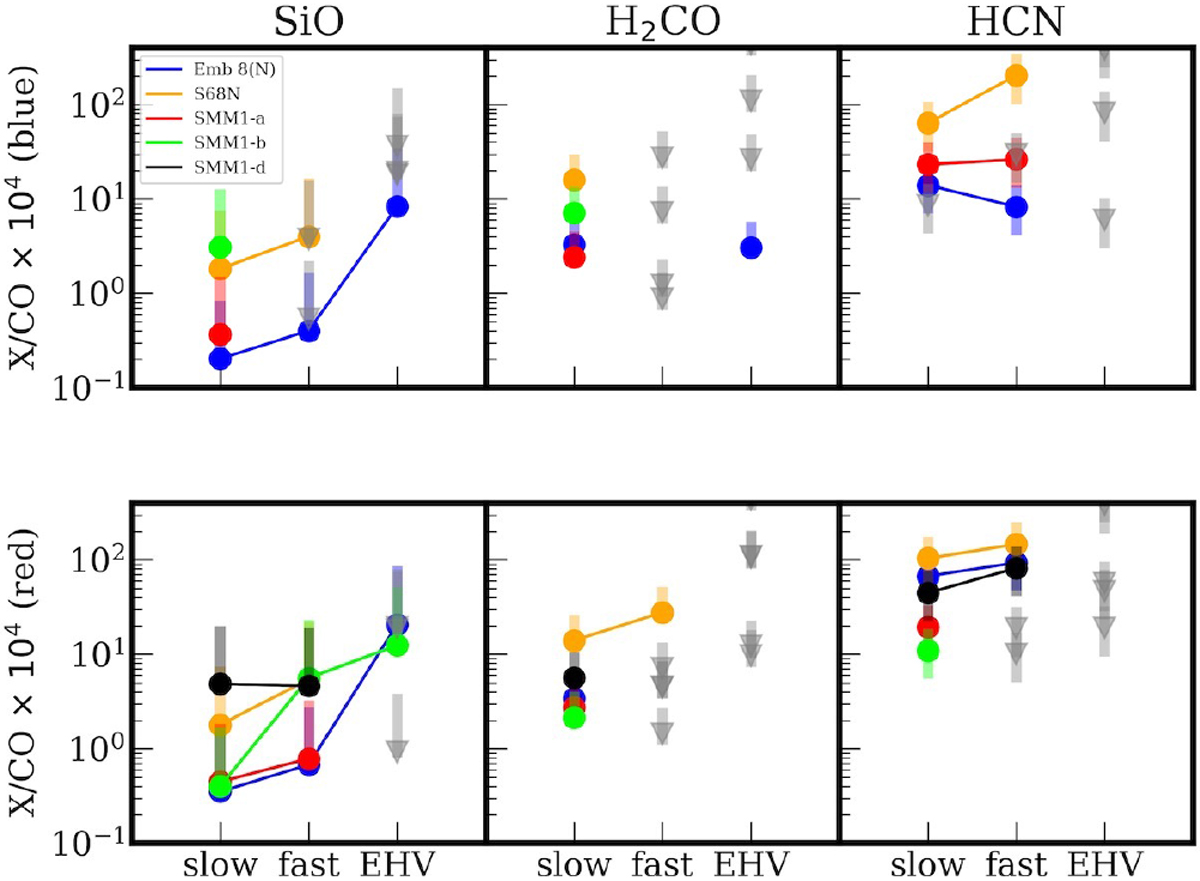
Molecular abundances with respect to CO scaled by 104 for blueshifted (top) and redshifted (bottom) part of outflow for all sources. Gray triangles represent upper limits. Points on the plot show values calculated for the mean Tex of the range defined for each molecule, see Table 3. Error bars represent the column densities calculated for minimum and maximum values of the excitation temperature. To obtain the abundanceof the given molecule, the column density was divided by the CO column density (for Tex = 75 K.) measured in the region in which the emission from the molecule was above 3σ. The HCN emission is likely optically thick and therefore the abundance should be treated as a lower limit.
Current usage metrics show cumulative count of Article Views (full-text article views including HTML views, PDF and ePub downloads, according to the available data) and Abstracts Views on Vision4Press platform.
Data correspond to usage on the plateform after 2015. The current usage metrics is available 48-96 hours after online publication and is updated daily on week days.
Initial download of the metrics may take a while.