Fig. 3
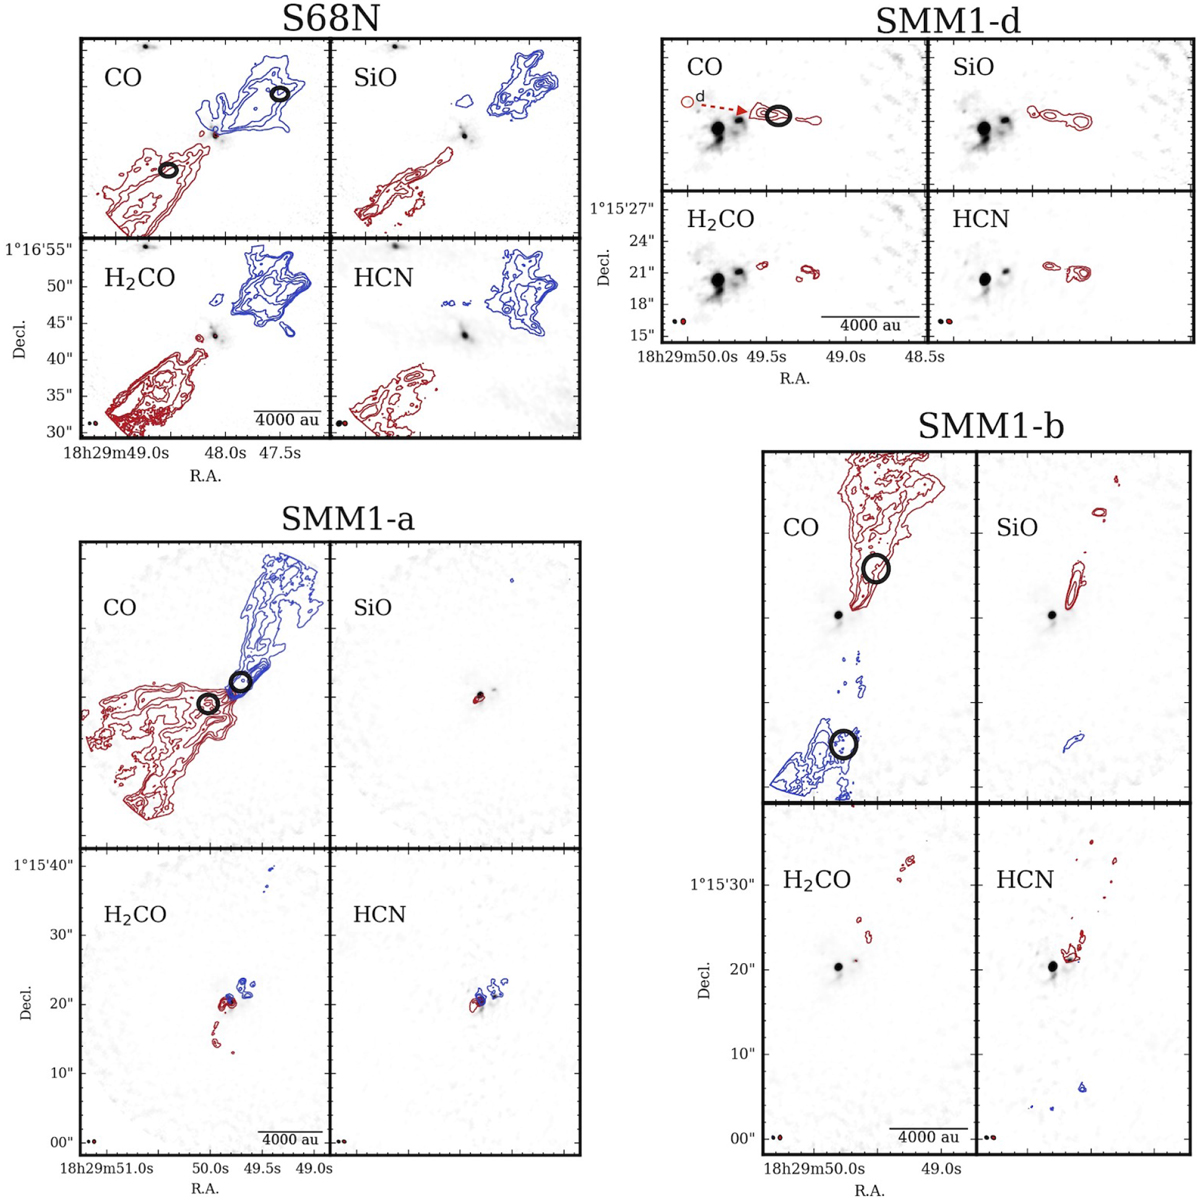
Similar to Fig. 2, but for remaining sources. S68N: contour levels are [3, 6, 9, 15, 20, 40, 60, 80, 100] for CO and HCN; [3, 8, 15, 30, 45] for SiO; and [3, 5, 9, 15, 20, 40] for H2CO, which were multiplied by the rms value of moment 0 maps. The rms values for the blueshifted and redshifted side of the outflow, in Kkm s−1: CO [19.5, 14.1], SiO [1.6, 1.9], H2CO [3.2, 2.0], and HCN [9.4, 12.7]. SMM1-a: contour levels are [3, 6, 9,15, 20, 40, 60, 80, 100] for all molecules, which were multiplied by the rms value of moment 0 maps. The rms values for the blueshifted and redshifted side of the outflow, in K km s−1 : CO [20.2, 20.6], SiO [3.6, 4.0], H2CO [2.0, 2.9], and HCN [7.5, 11.5]. SMM1-b: contour levels are [3, 6, 9, 15, 20, 40, 60, 80, 100] for CO, [3, 9, 36] for SiO, and [3, 5] for H2CO and HCN, which were multiplied by the rms value of moment 0 maps. The rms values for the blueshifted and redshifted side of the outflow, in K km s−1 : CO [18.7, 20.3], SiO [3.6, 4.0], H2CO [1.9, 2.9], and HCN [7.4, 11.5]. SMM1-d: only redshifted moment 0 map is presented as no blueshifted component has been detected toward this source. Contour levels are [3, 6, 9, 15, 20, 40, 60, 80, 100] for CO and HCN, [3, 12, 36] for SiO, and [2, 3] for H2CO, which were multiplied by the rms value of moment 0 maps. The rms values in K km s−1 are: CO [20.1], SiO [3.3], H2CO [2.7], and HCN [9.1]. Black ellipses indicate regions from which spectra were extracted for Fig. B.1.
Current usage metrics show cumulative count of Article Views (full-text article views including HTML views, PDF and ePub downloads, according to the available data) and Abstracts Views on Vision4Press platform.
Data correspond to usage on the plateform after 2015. The current usage metrics is available 48-96 hours after online publication and is updated daily on week days.
Initial download of the metrics may take a while.