Fig. 2
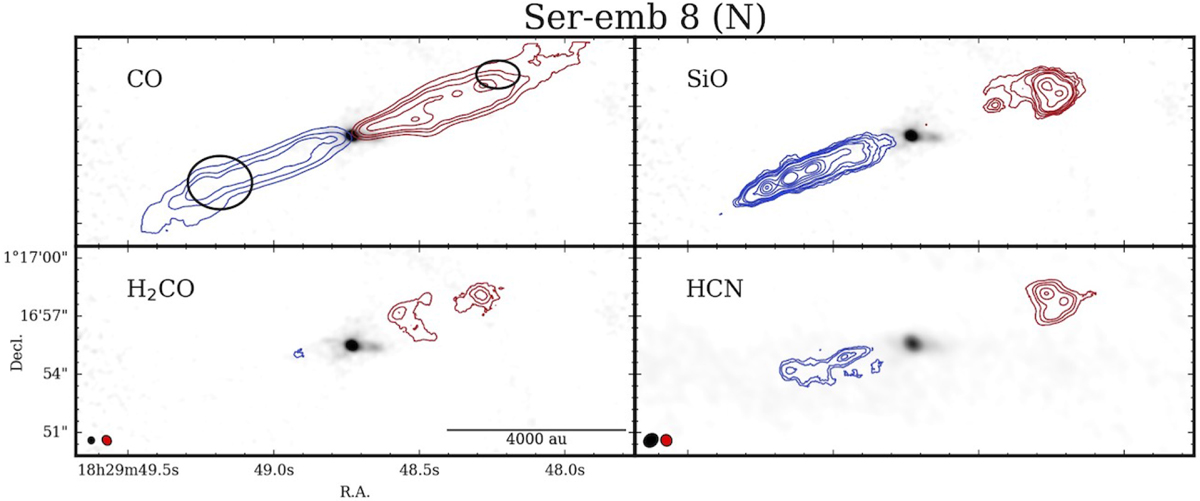
Integrated intensity maps of CO 2−1, SiO 5− 4, H2CO 303−202, and HCN 1−0 overlaid on the Band 6 (Band 3 for HCN) continuum in grayscale for Ser-emb 8 (N). The emission is integrated from the inner boundary of the slow wing component to the outer boundary of the EHV component as listed in Table 2 for the red and blueshifted emission. The exceptions are SiO and H2CO maps where only the channels obtained at high spatial resolution are plotted (<26 km s−1 for H2CO and <40 km s−1 for SiO). The synthesized beam size of the continuum images is 0.′′35 × 0.′′33 for Band 6 and 0.′′79 × 0.′′64 for Band 3; for spectral lines it is 0.′′53 × 0.′′45 (CO), 0.′′55 × 0.′′45 (SiO), 0.′′53 × 0.′′44 (H2CO), and 0.′′60 × 0.′′56 (HCN). The beam size of the Band 6 spectral line is presented in the bottom-left corner of the H2CO map and in HCN map for Band 3. Contour levels are [3, 6, 9, 15, 20, 40, 60, 80, 100] for CO, SiO, H2CO, and redshifted HCN, and [2, 3, 5, 6, 12] for blueshifted HCN, which were multiplied by rms value of moment 0 maps. The rms values for the blueshifted and redshifted side of the outflow in K km s−1 is as follows: CO [19.7, 14.4], SiO [2.2, 2.5], H2CO [2.8, 2.1], and HCN [9.3, 12.2]. Black ellipses indicate regions from which spectra were extracted for Figs. 4 and B.1.
Current usage metrics show cumulative count of Article Views (full-text article views including HTML views, PDF and ePub downloads, according to the available data) and Abstracts Views on Vision4Press platform.
Data correspond to usage on the plateform after 2015. The current usage metrics is available 48-96 hours after online publication and is updated daily on week days.
Initial download of the metrics may take a while.