Fig. B.2
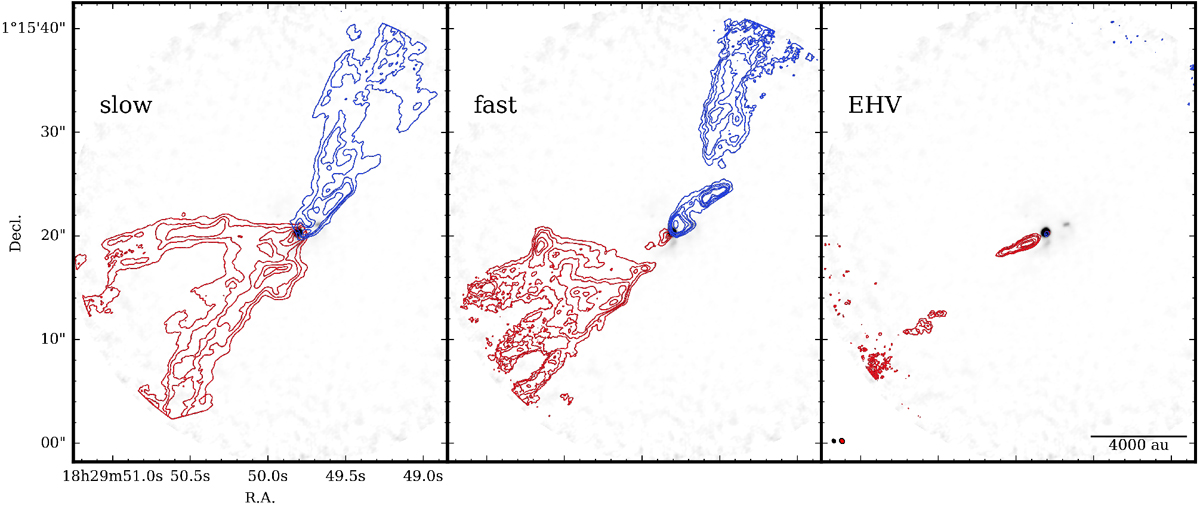
Integrated intensity maps of CO for different velocity regimes overlaid on Band 6 continuumin grayscale for SMM1-a. The emission is integrated over the velocities listed in Table 2. The synthesized beam of the CO (red) and continuum (black) is presented in bottom-left corner of EHV plot. The synthesized beam size of the continuum images is 0.′′35 × 0.′′33 and 0.′′55 × 0.′′45 for CO map. The contours are [3, 6, 9, 15, 20, 40] times the rms value. The rms values for each velocity channel, which are blueshifted and redshifted in K km s−1, are slow [18.8, 20.5], fast[5.8, 7.2], EHV [2.0, 2.8].
Current usage metrics show cumulative count of Article Views (full-text article views including HTML views, PDF and ePub downloads, according to the available data) and Abstracts Views on Vision4Press platform.
Data correspond to usage on the plateform after 2015. The current usage metrics is available 48-96 hours after online publication and is updated daily on week days.
Initial download of the metrics may take a while.