Fig. B.1
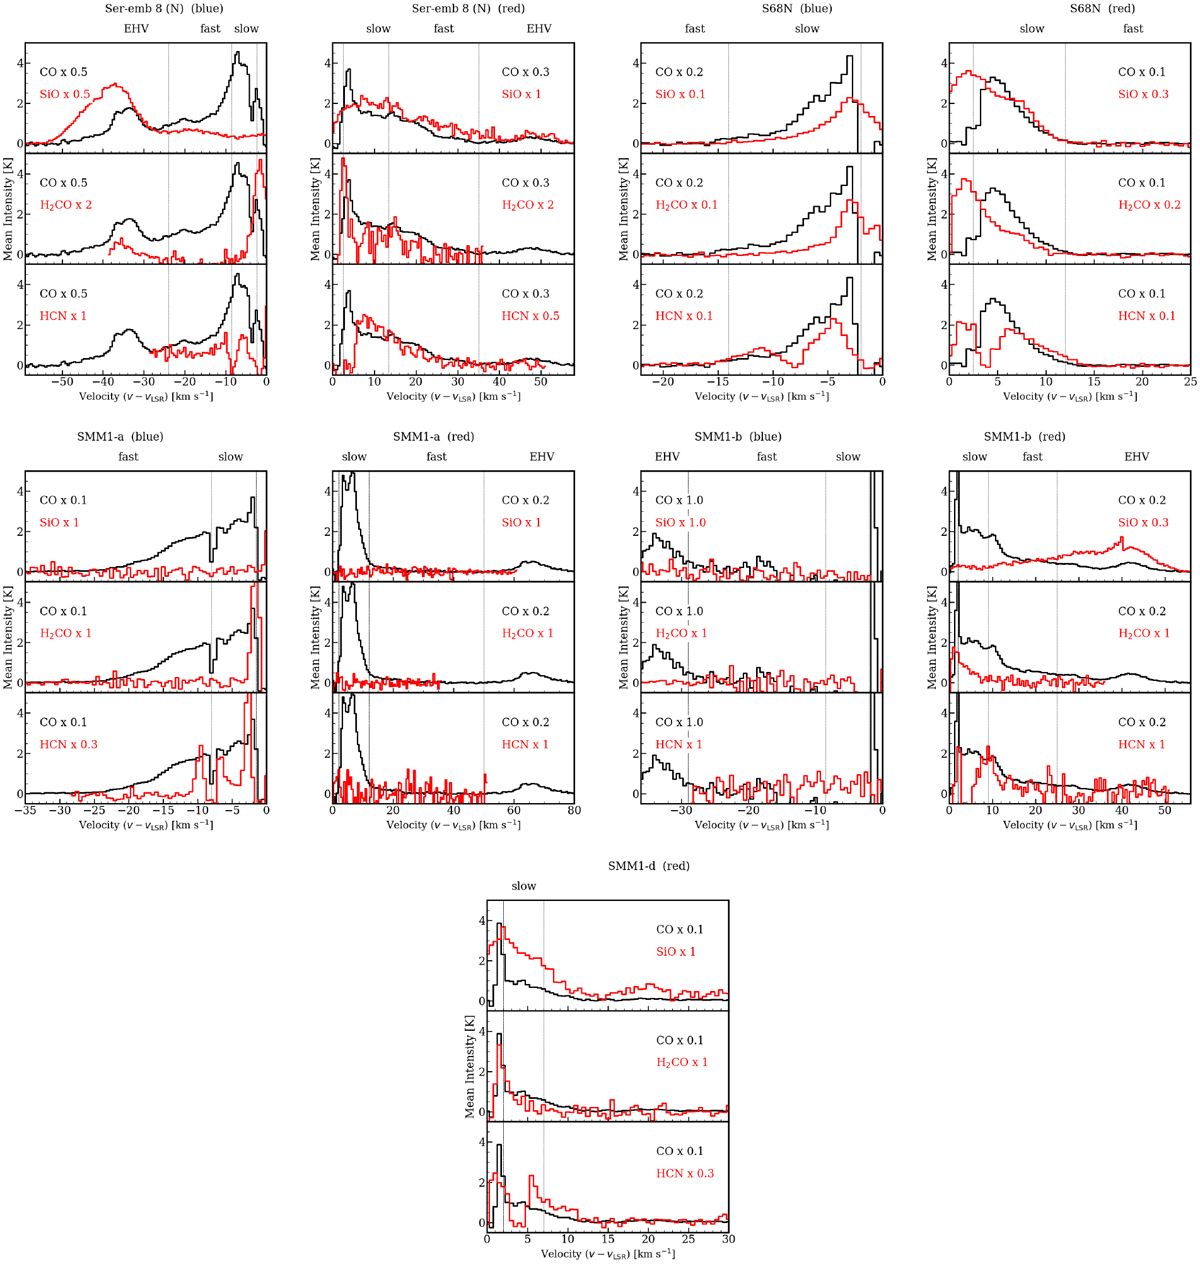
Spectra of CO in black, and different molecules as annotated in top-right corner in red. Spectra extracted from selected partof the outflow to highlight the key velocity components indicated in Figs. 2 and 3. Vertical dashed lines represent boundaries between different velocity regimes: slow wing, fast wing, and extremely high velocity.
Current usage metrics show cumulative count of Article Views (full-text article views including HTML views, PDF and ePub downloads, according to the available data) and Abstracts Views on Vision4Press platform.
Data correspond to usage on the plateform after 2015. The current usage metrics is available 48-96 hours after online publication and is updated daily on week days.
Initial download of the metrics may take a while.