Fig. A.1
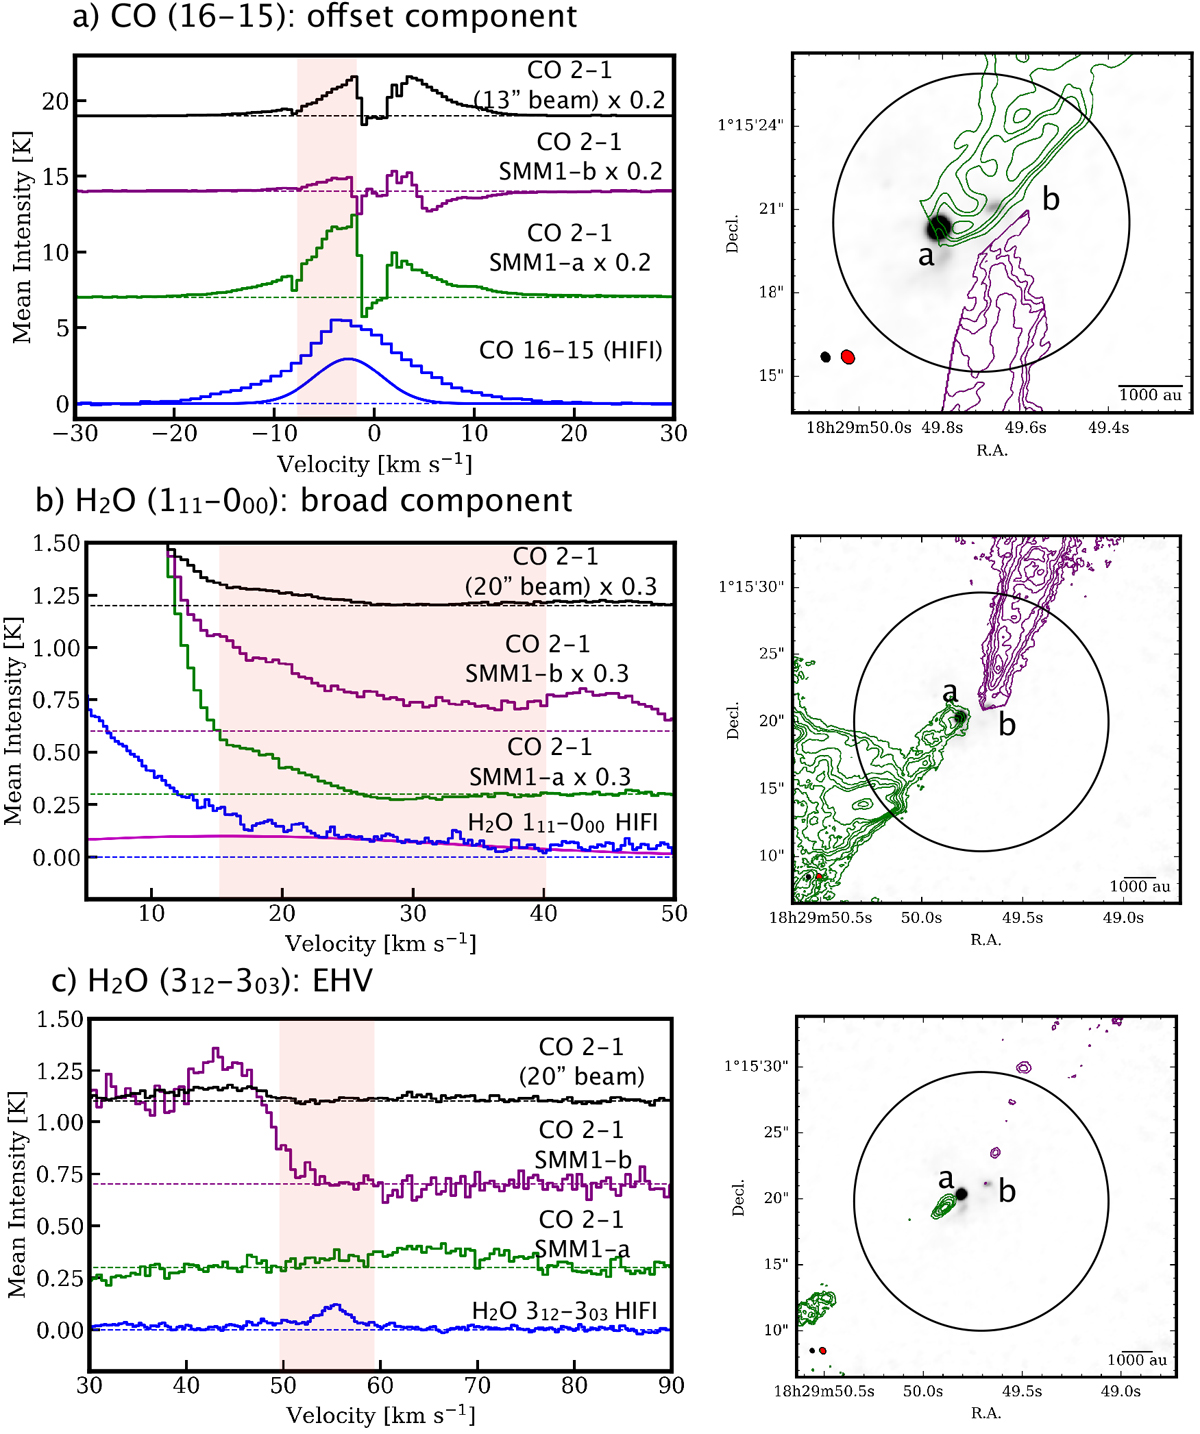
Comparison of CO 2−1 emission from SMM1 system with HIFI observations. Left: spectra from HIFI (blue), ALMA integrated with HIFI beam (black), ALMA spectra integrated with regions drawn to capture all emission from SMM1-a (purple) and SMM1-b (green) within HIFI beam. The velocity range from which the moment 0 map on the right was produced is indicated with the red shade. The Gaussian profiles for the relevant velocity components that were fit to the HIFI profiles for CO 16–15 (Kristensen et al. 2012) and H2O (Mottram et al. 2014) are shown. Right: moment 0 maps made by integrating the emission from range indicated by the red, shaded box on the left. Colors correspond to the spectra with SMM1-a outflow in green and SMM1-b outflow in purple. HIFI beam is plotted as a black circle. The beam size of the ALMA Band 6 spectral line (red) and continuum (black) is presented in the bottom-left corner of images.
Current usage metrics show cumulative count of Article Views (full-text article views including HTML views, PDF and ePub downloads, according to the available data) and Abstracts Views on Vision4Press platform.
Data correspond to usage on the plateform after 2015. The current usage metrics is available 48-96 hours after online publication and is updated daily on week days.
Initial download of the metrics may take a while.