Fig. 12
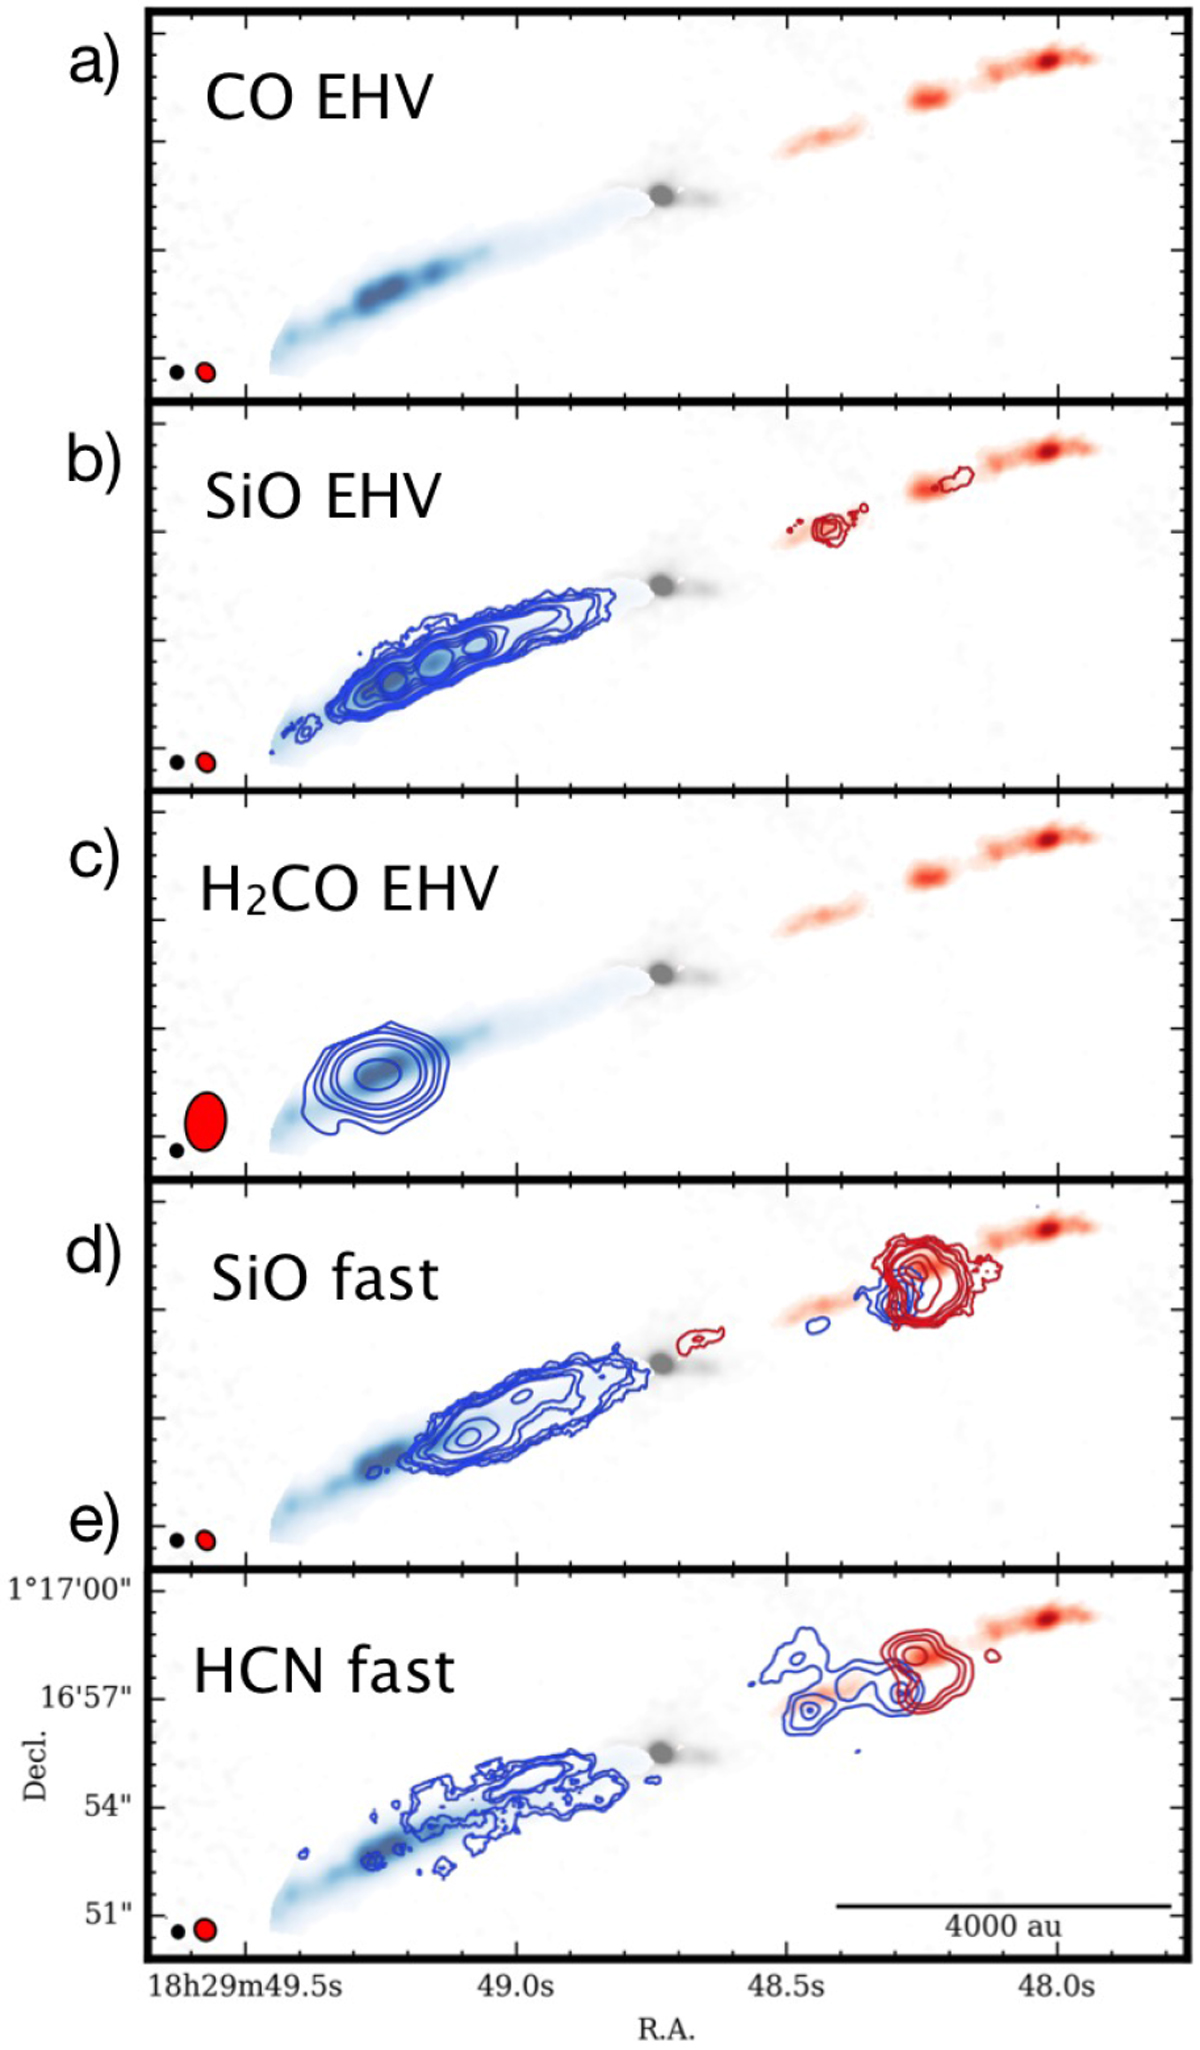
Schematic view of spatial distribution of different molecules and their relation with different velocity components in Ser-emb 8 (N) outflow. (a) In colorscale the CO moment 0 map is shown integrated over the EHV velocities, also overlaid on the following plots; (b) contours are SiO EHV emission captured at high spatial resolution, i.e., below 40 km s−1 ; (c) H2CO EHV emission (available only at low spatial resolution - synthesized beam is 1.′′65 × 1.′′13); (d) SiO fastwing emission; (e) HCN fast wing emission. The synthesized beams of continuum (black) and contour map (red) is shown in bottom-left corner.
Current usage metrics show cumulative count of Article Views (full-text article views including HTML views, PDF and ePub downloads, according to the available data) and Abstracts Views on Vision4Press platform.
Data correspond to usage on the plateform after 2015. The current usage metrics is available 48-96 hours after online publication and is updated daily on week days.
Initial download of the metrics may take a while.