Fig. 2
![]() 202 − 111
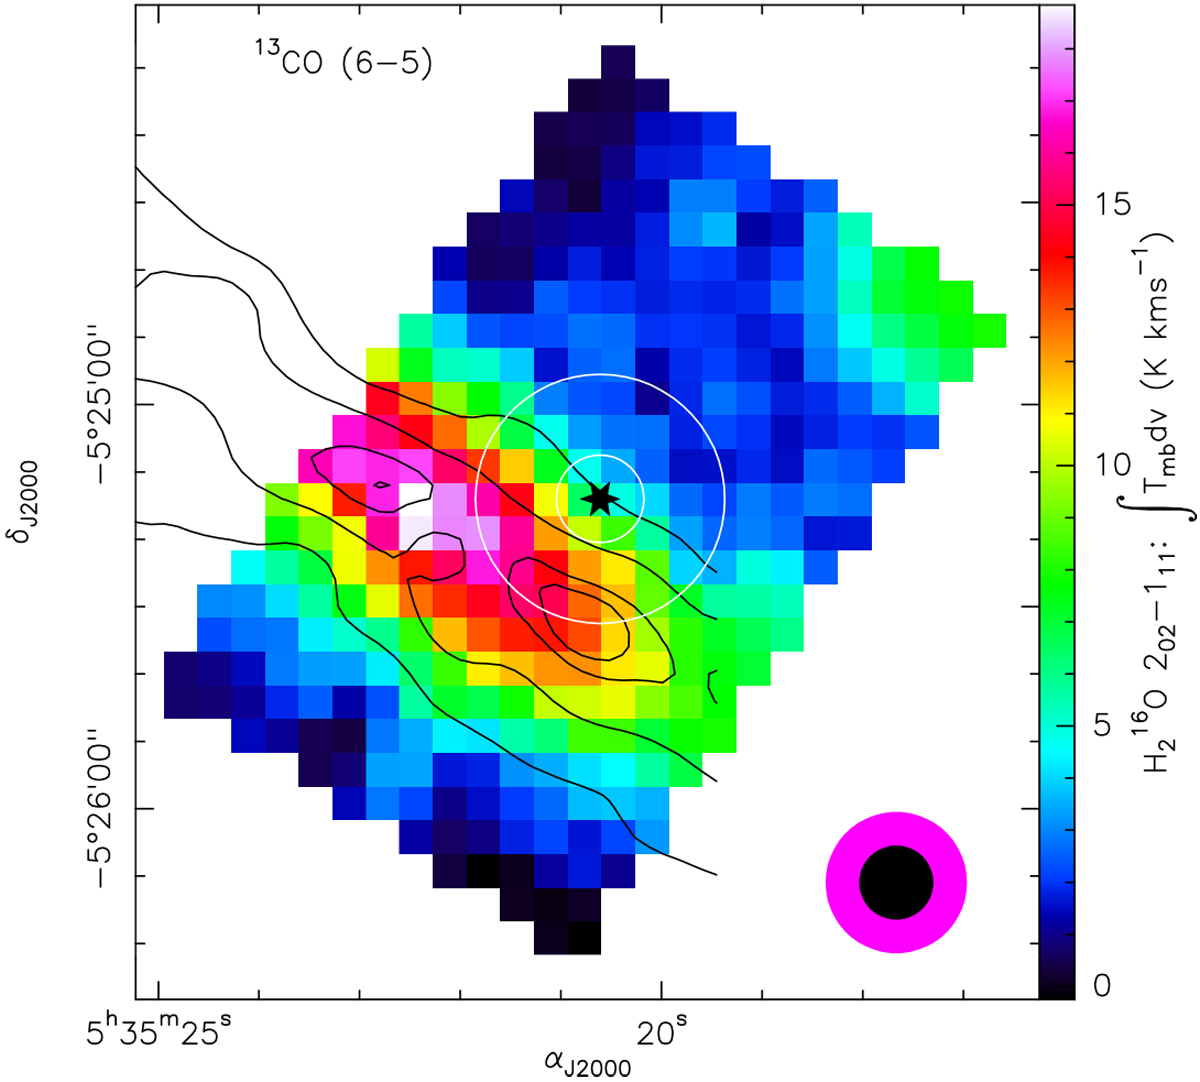
emission map at 988 GHz integrated from 7.7 to 13.5 km s−1. Contours represent the emission of 13CO
6− 5 at 95, 90, 75 and 50% of the maximum intensity, integrated from 2 to 17 km s−1, observed with the CSO at a resolution of 11′′. Black star marks the CO+
peak position, white circles show the HIFI HPBW at the extreme frequencies, black and magenta disks show the CSO and 988 GHz HIFI beam width (see Table 1). FUV field from the Trapezium cluster comes from the upper right corner.
202 − 111
emission map at 988 GHz integrated from 7.7 to 13.5 km s−1. Contours represent the emission of 13CO
6− 5 at 95, 90, 75 and 50% of the maximum intensity, integrated from 2 to 17 km s−1, observed with the CSO at a resolution of 11′′. Black star marks the CO+
peak position, white circles show the HIFI HPBW at the extreme frequencies, black and magenta disks show the CSO and 988 GHz HIFI beam width (see Table 1). FUV field from the Trapezium cluster comes from the upper right corner.
Current usage metrics show cumulative count of Article Views (full-text article views including HTML views, PDF and ePub downloads, according to the available data) and Abstracts Views on Vision4Press platform.
Data correspond to usage on the plateform after 2015. The current usage metrics is available 48-96 hours after online publication and is updated daily on week days.
Initial download of the metrics may take a while.