Fig. A.5
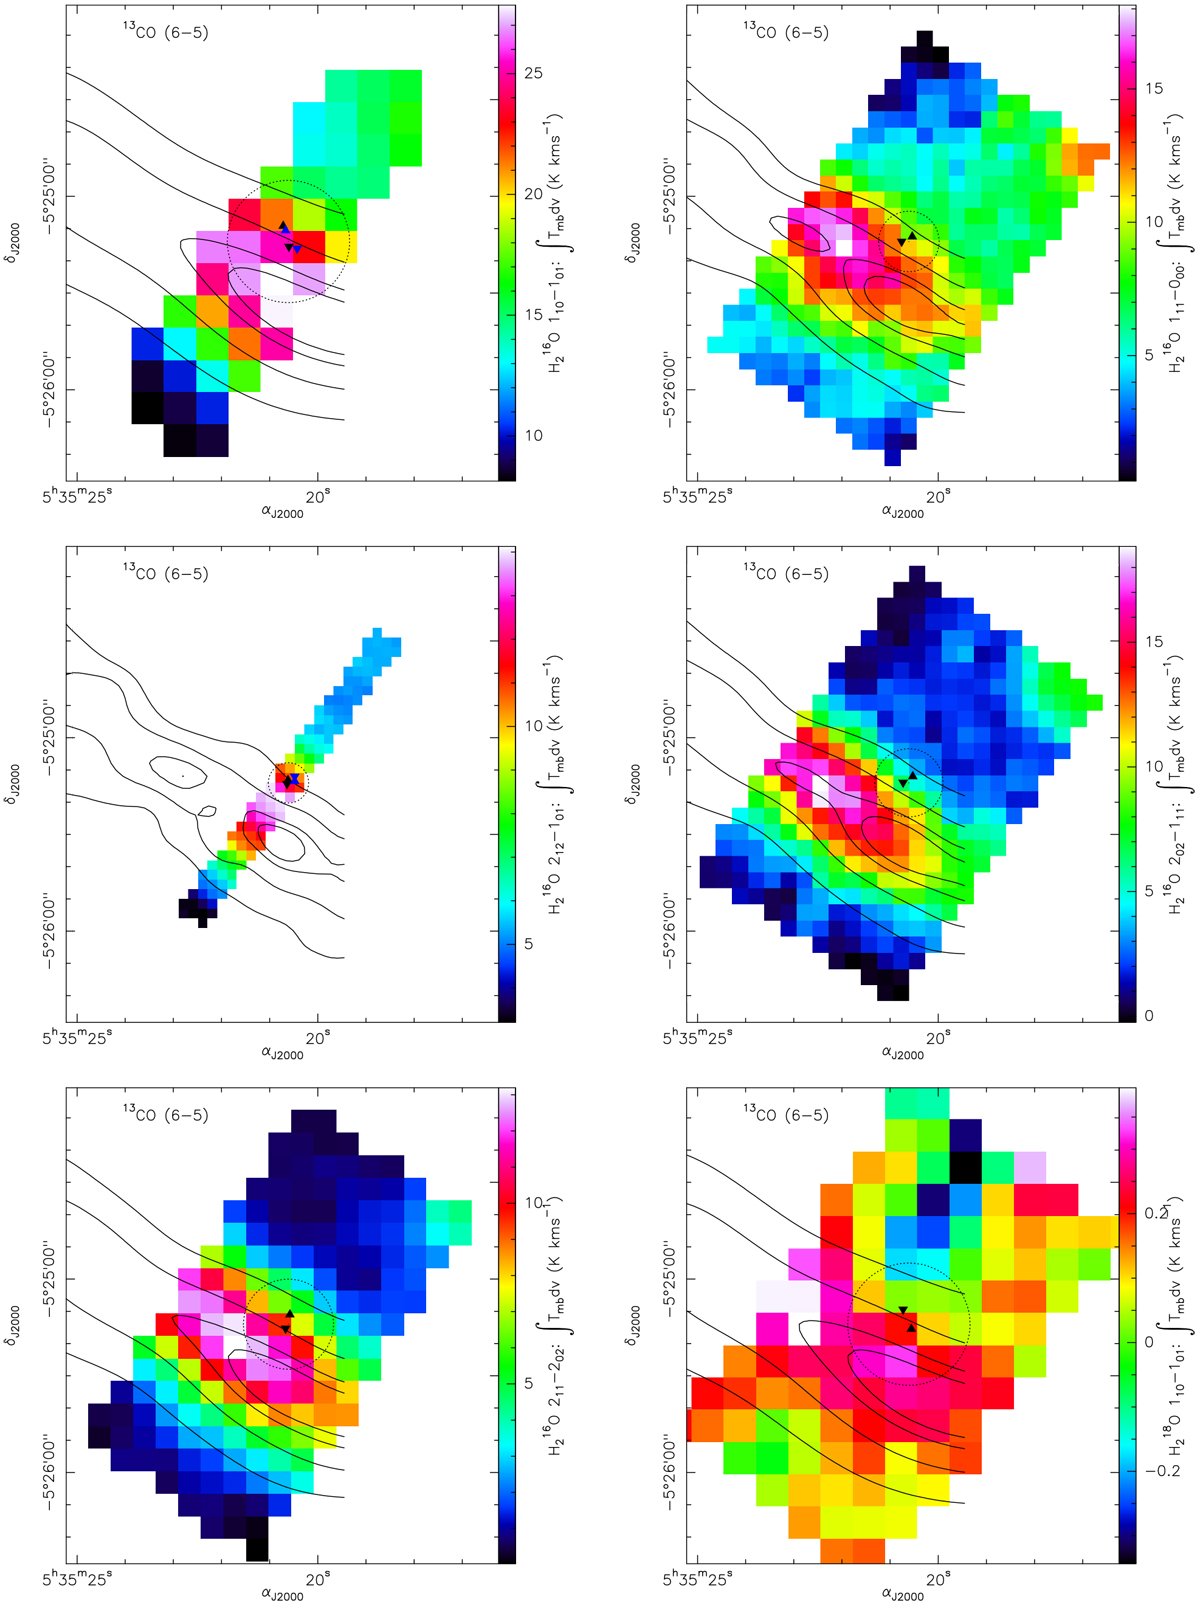
Water emission maps averaged for H and V polarizations. Integration ranges are given in Table A.1. Black solid contours represent the emission of 13CO 6− 5 at 95, 90, 75 and 50% of the maximum intensity integrated from 2 to 17 km s−1 observed with the CSO telescope and convolved at the averaged water line H and V beam width (Table A.1). Upward and downward triangles mark the targeted observations for H and V polarizations (blue ones are for the b labeled transitions, see Tables 1 and A.1). Black dashed circle is the HIFI HPBW at the water frequency centered on the CO+ peak.
Current usage metrics show cumulative count of Article Views (full-text article views including HTML views, PDF and ePub downloads, according to the available data) and Abstracts Views on Vision4Press platform.
Data correspond to usage on the plateform after 2015. The current usage metrics is available 48-96 hours after online publication and is updated daily on week days.
Initial download of the metrics may take a while.