Fig. A.4
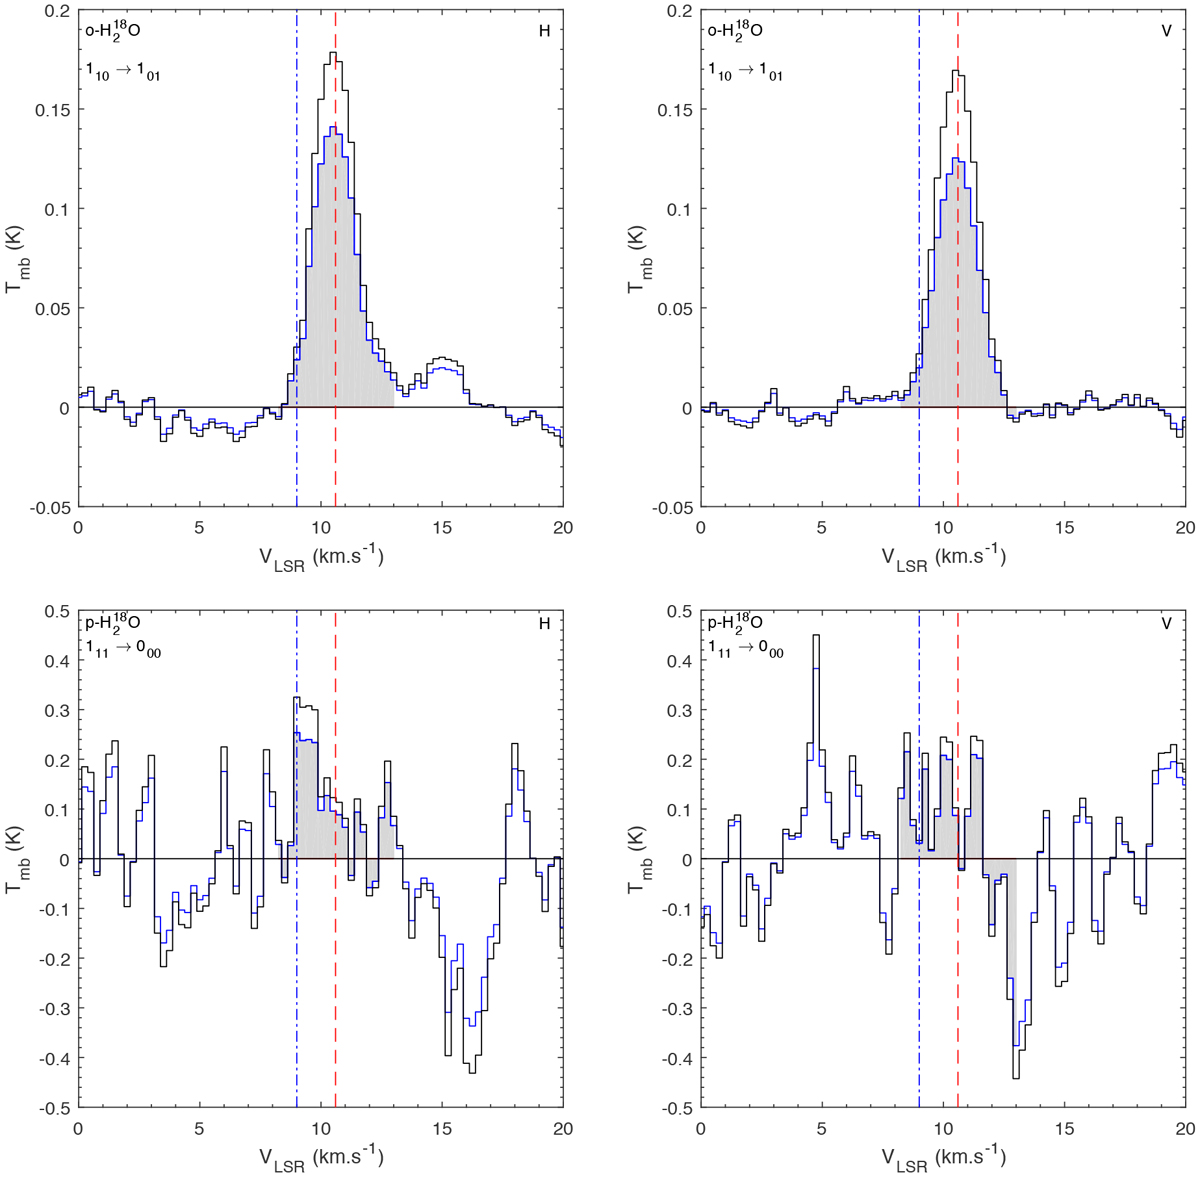
Line profile of ![]() for H (left panels) and V (right panels) polarization. The blue solid line is the spectrum corrected for HIFI calibration, the black solid line is the spectrum corrected for the beam coupling factor, the blue dash-dotted line and red dashed line represent Orion Bar and Orion Ridge velocity features and the gray area is the velocity integration range.
for H (left panels) and V (right panels) polarization. The blue solid line is the spectrum corrected for HIFI calibration, the black solid line is the spectrum corrected for the beam coupling factor, the blue dash-dotted line and red dashed line represent Orion Bar and Orion Ridge velocity features and the gray area is the velocity integration range.
Current usage metrics show cumulative count of Article Views (full-text article views including HTML views, PDF and ePub downloads, according to the available data) and Abstracts Views on Vision4Press platform.
Data correspond to usage on the plateform after 2015. The current usage metrics is available 48-96 hours after online publication and is updated daily on week days.
Initial download of the metrics may take a while.